

Caloric restriction controls stationary phase survival through Protein Kinase A (PKA) and cytosolic pH
- PMID: 30790427
- PMCID: PMC6516148
- DOI: 10.1111/acel.12921
Caloric restriction controls stationary phase survival through Protein Kinase A (PKA) and cytosolic pH
Abstract
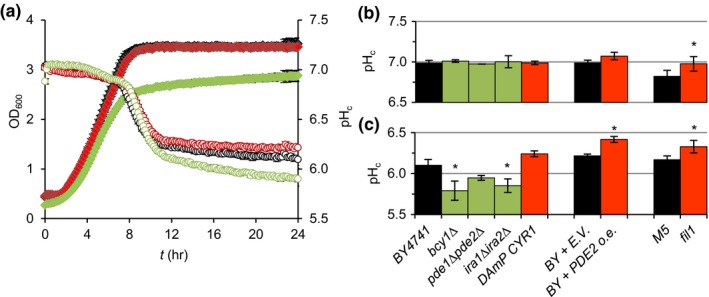
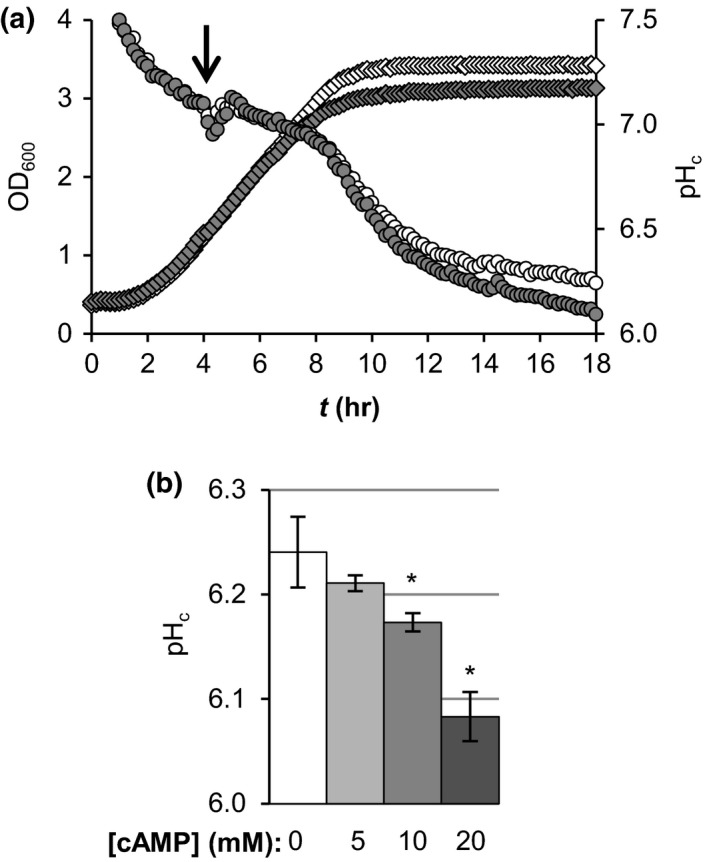
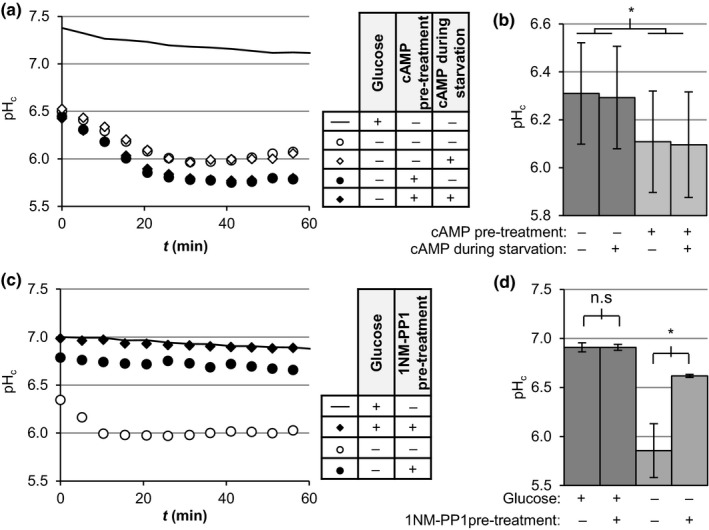
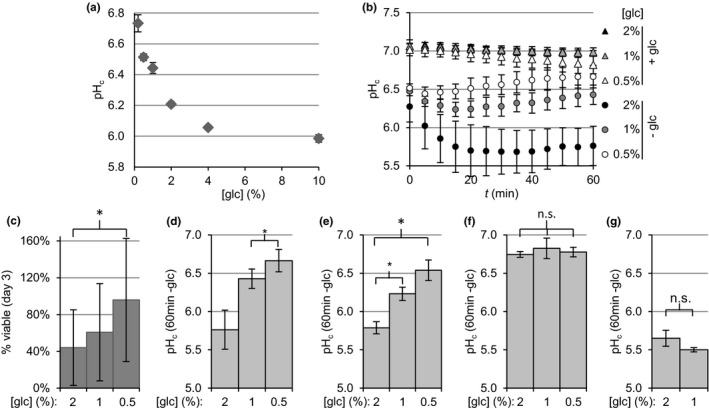
Calorie restriction is the only physiological intervention that extends lifespan throughout all kingdoms of life. In the budding yeast Saccharomyces cerevisiae, cytosolic pH (pHc ) controls growth and responds to nutrient availability, decreasing upon glucose depletion. We investigated the interactions between glucose availability, pHc and the central nutrient signalling cAMP-Protein Kinase A (PKA) pathway. Glucose abundance during the growth phase enhanced acidification upon glucose depletion, via modulation of PKA activity. This actively controlled reduction in starvation pHc correlated with reduced stationary phase survival. Whereas changes in PKA activity affected both acidification and survival, targeted manipulation of starvation pHc showed that cytosolic acidification was downstream of PKA and the causal agent of the reduced chronological lifespan. Thus, caloric restriction controls stationary phase survival through PKA and cytosolic pH.
Keywords: Saccharomyces cerevisiae; cAMP; calorie restriction; chronological lifespan; glucose; intracellular pH.
© 2019 The Authors. Aging Cell published by the Anatomical Society and John Wiley & Sons Ltd.
Conflict of interest statement
None Declared.
Figures
Similar articles
-
Novel sensing mechanisms and targets for the cAMP-protein kinase A pathway in the yeast Saccharomyces cerevisiae.Mol Microbiol. 1999 Sep;33(5):904-18. doi: 10.1046/j.1365-2958.1999.01538.x. Mol Microbiol. 1999. PMID: 10476026 Review.
-
Calorie restriction extends Saccharomyces cerevisiae lifespan by increasing respiration.Nature. 2002 Jul 18;418(6895):344-8. doi: 10.1038/nature00829. Nature. 2002. PMID: 12124627
-
The lag phase rather than the exponential-growth phase on glucose is associated with a higher cAMP level in wild-type and cAPK-attenuated strains of the yeast Saccharomyces cerevisiae.Microbiology (Reading). 1997 Nov;143 ( Pt 11):3451-3459. doi: 10.1099/00221287-143-11-3451. Microbiology (Reading). 1997. PMID: 9387223
-
Dietary restriction depends on nutrient composition to extend chronological lifespan in budding yeast Saccharomyces cerevisiae.PLoS One. 2013 May 17;8(5):e64448. doi: 10.1371/journal.pone.0064448. Print 2013. PLoS One. 2013. PMID: 23691220 Free PMC article.
-
Mechanisms that Link Chronological Aging to Cellular Quiescence in Budding Yeast.Int J Mol Sci. 2020 Jul 2;21(13):4717. doi: 10.3390/ijms21134717. Int J Mol Sci. 2020. PMID: 32630624 Free PMC article. Review.
Cited by
-
Partitioning into ER membrane microdomains impacts autophagic protein turnover during cellular aging.Sci Rep. 2024 Jun 13;14(1):13653. doi: 10.1038/s41598-024-64493-8. Sci Rep. 2024. PMID: 38871812 Free PMC article.
-
Physiological responses of Saccharomyces cerevisiae to industrially relevant conditions: Slow growth, low pH, and high CO2 levels.Biotechnol Bioeng. 2020 Mar;117(3):721-735. doi: 10.1002/bit.27210. Epub 2020 Jan 22. Biotechnol Bioeng. 2020. PMID: 31654410 Free PMC article.
-
The intricate role of Sir2 in oxidative stress response during the post-diauxic phase in Saccharomyces cerevisiae.Front Microbiol. 2023 Nov 9;14:1285559. doi: 10.3389/fmicb.2023.1285559. eCollection 2023. Front Microbiol. 2023. PMID: 38029141 Free PMC article.
-
Aberrant Intracellular pH Regulation Limiting Glyceraldehyde-3-Phosphate Dehydrogenase Activity in the Glucose-Sensitive Yeast tps1Δ Mutant.mBio. 2020 Oct 27;11(5):e02199-20. doi: 10.1128/mBio.02199-20. mBio. 2020. PMID: 33109759 Free PMC article.
-
The Role of Sch9 and the V-ATPase in the Adaptation Response to Acetic Acid and the Consequences for Growth and Chronological Lifespan.Microorganisms. 2021 Sep 3;9(9):1871. doi: 10.3390/microorganisms9091871. Microorganisms. 2021. PMID: 34576766 Free PMC article.
References
-
- Ambesi, A. , Miranda, M. , Petrov, V. V. , & Slayman, C. W. (2000). Biogenesis and function of the yeast plasma‐membrane H(+)‐ATPase. The Journal of Experimental Biology, 203(Pt 1), 155–160. http://www.ncbi.nlm.nih.gov/pubmed/10600684 - PubMed
-
- Arlia‐Ciommo, A. , Piano, A. , Leonov, A. , Svistkova, V. , & Titorenko, V. I. (2014). Quasi‐programmed aging of budding yeast: A trade‐off between programmed processes of cell proliferation, differentiation, stress response, survival and death defines yeast lifespan. Cell Cycle, 13(21), 3336–3349. 10.4161/15384101.2014.965063 - DOI - PMC - PubMed
MeSH terms
Substances
LinkOut - more resources
Full Text Sources
Molecular Biology Databases
Research Materials
