Review
. 2019 Apr 1;151(4):417-434.
doi: 10.1085/jgp.201812298. Epub 2019 Feb 19.

Unraveling the mechanisms of calcium-dependent secretion

Affiliations
Review

Unraveling the mechanisms of calcium-dependent secretion

Arun Anantharam et al. J Gen Physiol. .

Abstract

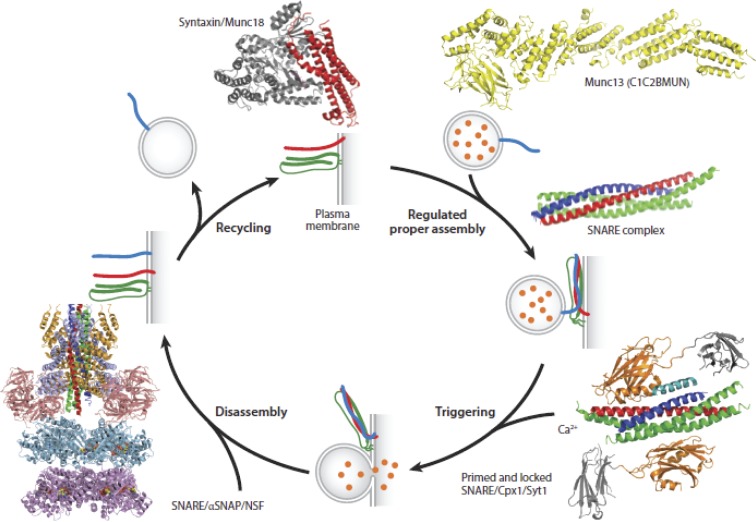
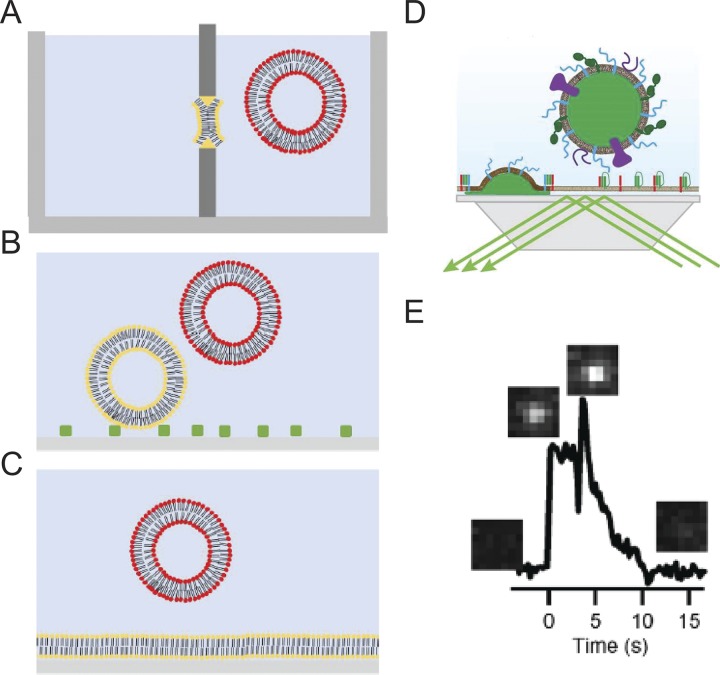
Ca2+-dependent secretion is a process by which important signaling molecules that are produced within a cell-including proteins and neurotransmitters-are expelled to the extracellular environment. The cellular mechanism that underlies secretion is referred to as exocytosis. Many years of work have revealed that exocytosis in neurons and neuroendocrine cells is tightly coupled to Ca2+ and orchestrated by a series of protein-protein/protein-lipid interactions. Here, we highlight landmark discoveries that have informed our current understanding of the process. We focus principally on reductionist studies performed using powerful model secretory systems and cell-free reconstitution assays. In recent years, molecular cloning and genetics have implicated the involvement of a sizeable number of proteins in exocytosis. We expect reductionist approaches will be central to attempts to resolve their roles. The Journal of General Physiology will continue to be an outlet for much of this work, befitting its tradition of publishing strongly mechanistic, basic research.


Figures

Figure 1.
Figure 1.
Morphological changes accompanying secretion are identified by EM. (A) Mucocyst discharge in the ciliated protist Tetrahymena pyriformis. A longitudinal section showing a cilium, its accompanying parasomal sac (ps), and a discharging mucocyst. Magnification × 72,000. Taken from Satir et al. (1973), A is reprinted with the permission of the Journal of Cell Biology. (B) A wave of sea urchin cortical granule exocytosis in light micrographs and in freeze-fracture replicas. Top left: Initiation of exocytosis at arrow with raising of fertilization membrane. Magnification × 800. Top right: Numerous small elevations at arrows are evident as wave of fusion propagates. Bottom left: Exocytosis is complete as indicated by a fully elevated membrane and absence of granules. Bottom right: “Face-on” view of exocytotic “wave” with darkened spots indicating locations of fusion events. Magnification × 2,000. Bar, 10 µm for all images. Taken from Chandler and Heuser (1979), B is reprinted with the permission of the Journal of Cell Biology. (C) Images of a secretory event in the rat posterior pituitary. a: A granule fused with the cell membrane and possibly communicating with the extracellular space via a narrow opening. b: A fusion-associated “omega figure” in which the opening to the extracellular space is more evident. c and d: The opening has now expanded to the point where the granule contents may be discharged completely to the extracellular space. Magnification × 96,000. Taken from Nagasawa et al. (1970), C is reprinted with the permission of Nature.
Figure 2.
Figure 2.
Events associated with fusion in the planar bilayer assay. (A) Progression of events associated with fusion from left to right. A multilamellar vesicle is situated on the cis side of a planar bilayer. It contains ion-permeable channels (rectangles) and a fluorescent dye (dots) trapped in its aqueous compartments. With fusion of the vesicle with the membrane, the fluorescent dots begin to escape to the trans side of the membrane. The ion-permeable channels are now in the planar membrane. The key to detection of fluorescence on the trans side is the presence of a vesicle which has lost only its outer lamella during fusion but retains fluorescence dye within aqueous compartments. Taken from Zimmerberg et al. (1980a). (B) When VDAC-containing liposomes are added to the cis compartment, no conductance increases are initially detectable. After addition of 30 mM CaCl2, a single jump is observed (a). When voltage is switched to 40 mV, several channels are seen turning off, demonstrating that the current jump resulted from the insertion of several channels. Taken from Cohen et al. (1980).
Figure 3.
Figure 3.
Fluorescence-based imaging of single-vesicle fusion. (A) Diagram of the fluorescence microscope arrangement and video equipment. The light sources, filters, dichroic mirror, objective, condenser, and eyepieces were components of an upright microscope laid on its backbrace. (B) Individual movie frames from the video record are temporally arranged from left to right and top to bottom. The first panel indicates the time immediately before vesicle rupture and release of calcein (subsequent frames); the intact vesicle is indicated by an arrowhead. The final frame indicates the original location of the vesicle, which is no longer evident. Taken from Niles and Cohen (1987).
Figure 4.
Figure 4.
Ca2+-dependent release of intracellular constituents from intact and permeabilized bovine adrenal chromaffin cells. (A) Ca2+-dependent release from intact bovine chromaffin cells in response to 500 µM of the cholinergic agonist carbamylcholine (closed circles), to 500 µM of veratridine (closed squares), and to a potassium challenge (open circle). In all cases, secretion is half-maximal at Ca2+ concentrations between 0.1 and 1 mM and is associated with release of the granule protein dopamine β-hydroxylase but not the cytosolic protein lactate dehydrogenase. A and C are taken from Baker and Knight (1978) and are reprinted with permission from Nature. (B) The experimental setup used to expose a suspension of cells to a brief electric field. Taken from Baker and Knight (1981), B is reprinted with permission from Philosophical Transactions of the Royal Society of London. Series B, Biological Sciences. (C) Ca2+-dependent release of catecholamines (closed circles), dopamine β-hydroxylase (open circles), and lactate dehydrogenase (closed diamond) in response to electrical discharges. (D) Ca2+-dependent release of [3H]norepinephrine into the medium of digitonin permeabilized chromaffin cells or intact cells exposed to the nicotinic agonist carbochol. Taken from Dunn and Holz (1983), D is reprinted with permission from the Journal of Biological Chemistry.
Figure 5.
Figure 5.
The role of inositol phospholipids in fusion. (A) PH-GFP identifies primarily PI(4,5)P2 in the plasma membrane (note fluorescence in cell periphery; left panel). When a critical basic residue for the interaction is mutated, GFP does not label the plasma membrane. Taken from Holz et al. (2000), A is reprinted with permission from the Journal of Biological Chemistry. (B) The localization of PI(4,5)P2 (red) in the membrane may promote protein–lipid interactions (blue) for formation of fusion pores. Expression of PI(4,5)P2 on the granule membrane may thwart those interactions. B is based on Abbineni et al. (2018).
Figure 6.
Figure 6.
Heterogeneity of Ca2+ responses of cortical granules in the planar cortex assay. (A) Cortices treated with 0.1 µM Ca2+ (left panel) or 17 µM Ca2+ (right panel). Taken from Zimmerberg et al. (1985), A is reprinted with permission from the Journal of Cell Biology. (B) Fusion of cortical granules depends on the final concentration of Ca2+ used and not the time between Ca2+ challenges. (C) Fusion of cortical granules does not depend on the number of Ca2+ steps used to reach the final concentration. For B and C, the upward and downward arrows signify Ca2+ addition or removal. The cortices in B were stimulated with 24 µM Ca2+ and then washed for 0.5, 1, 3, 10, or 30 min in 0 Ca2+ before being stimulated again. The largest arrow signifies >300 µM Ca2+. The Ca2+ concentrations in C are 14, 24, and >300 µM for the double challenge curve (DP) and 24 and >300 µM for the single challenge curve (SP). B and C are taken from Blank et al. (1998a).
Figure 7.
Figure 7.
Patch-clamp electrophysiology enables real-time detection of granule fusion in mast cells. (A) A sketch of the exocytotic fusion pore that has resulted from fusion. Superimposed on the cartoon is the equivalent circuit. Rc and Cc, resistance and capacitance of the cell membrane; Rg and Cg, resistance and capacitance of the granule membrane; Rp, resistance of the fusion pore; and Rs, series resistance of the patch electrode. Taken from Zimmerberg et al. (1987), A is reprinted with permission from the Proceedings of the National Academy of Sciences of the United States of America. (B) Capacitance, C, and conductance, Gac, of a mast cell granule as it undergoes exocytosis. Taken from Spruce et al. (1990), B is reprinted with permission from Neuron. (C) Hypothetical sequence of events during exocytosis. The “flicker” between conducting and nonconducting states in the trace in B may arise from transitions between b and c in the model. Based on Breckenridge and Almers (1987), C is reprinted with permission from the Proceedings of the National Academy of Sciences of the United States of America.
Figure 8.
Figure 8.
The dependence of secretion on Ca2+. (A) The relationship between Ca2+ concentration and the amplitude of the end-plate potential (e.p.p.) displayed as a log–log plot. Fits at different Mg2+ concentrations are shown (open circle, 0.5 mM; plus, 2 mM; filled circle, 4 mM), all with an approximate slope of 4. This indicates that a fourth power relationship exists between the e.p.p. and Ca2+. Note, Mg2+ does not change the slope, but merely shifts the line along the x axis. Taken from Dodge and Rahamimoff (1967), A is reprinted with permission from the Journal of Physiology. (B) Catecholamine released from leaky cells as a result of raising Ca2+ concentration from 10−9 M (open diamonds) or 2 × 10⁻⁸ M (filled circle). The release (N) is expressed relative to the amount released at 10−5 M Ca2+. The numbers represent the number of observations, and error bars represent SEM. The solid line is a theoretical curve based on two Ca2+ ions involved in the secretory process; the dotted curve is based on 4; the dashed curve is based on 1. The inset is a Hill plot. The regression line has a slope of 2.2. Taken from Knight and Baker (1982), B is reprinted with permission from the Journal of Membrane Biology.
Figure 9.
Figure 9.
Structures of synaptic proteins and their complexes, which participate in Ca2+-triggered exocytosis. Shown are structures of the neuronal SNARE complex, the SNARE/Cpx1/Syt1 complex, the SNARE/αSNAP/NSF complex, the Munc18/syntaxin complex, and the C1C2MUN fragment of Munc13. Cpx1, complexin-1; Munc, mammalian uncoordinated. Taken from Brunger et al. (2018), Fig. 9 is reprinted with permission from the Annual Review of Biophysics.
Figure 10.
Figure 10.
Assays for reconstitution of membrane fusion. (A) Fusion between a planar membrane (yellow) and liposomes. (B) Vesicle–vesicle fusion where target vesicles (yellow) are tethered to the surface and fusion with secretory mimicking vesicles (red) is imaged. (C) Fusion between target planar supported bilayer (yellow) and secretory mimicking vesicle (red). (D) Cartoon of a “hybrid” granule docking and fusion assay performed using a prism-based TIRF microscope system. (E) A single fusion event of an Neuropeptide (NPY)-Ruby-labeled granule with a planar-supported bilayer containing t-SNAREs. Images corresponding to the appearance of the granule and release of NPY in the evanescent field are placed above an intensity versus time graph. Taken from Kreutzberger et al. (2017), E is reprinted with the permission of Science Advances.

Similar articles

Cited by

References

    1. Abbineni P.S., Hibbert J.E., and Coorssen J.R.. 2013. Critical role of cortical vesicles in dissecting regulated exocytosis: overview of insights into fundamental molecular mechanisms. Biol. Bull. 224:200–217. 10.1086/BBLv224n3p200 - DOI - PubMed
    1. Abbineni P.S., Axelrod D., and Holz R.W.. 2018. Visualization of expanding fusion pores in secretory cells. J. Gen. Physiol. 150:1640–1646. 10.1085/jgp.201812186 - DOI - PMC - PubMed
    1. Albillos A., Dernick G., Horstmann H., Almers W., Alvarez de Toledo G., and Lindau M.. 1997. The exocytotic event in chromaffin cells revealed by patch amperometry. Nature. 389:509–512. 10.1038/39081 - DOI - PubMed
    1. Ali S.M., Geisow M.J., and Burgoyne R.D.. 1989. A role for calpactin in calcium-dependent exocytosis in adrenal chromaffin cells. Nature. 340:313–315. 10.1038/340313a0 - DOI - PubMed
    1. Augustine G.J., and Neher E.. 1992. Calcium requirements for secretion in bovine chromaffin cells. J. Physiol. 450:247–271. 10.1113/jphysiol.1992.sp019126 - DOI - PMC - PubMed

Publication types