Identification of functional long non-coding RNAs in C. elegans
- PMID: 30777050
- PMCID: PMC6378714
- DOI: 10.1186/s12915-019-0635-7
Identification of functional long non-coding RNAs in C. elegans
Abstract
Background: Functional characterisation of the compact genome of the model organism Caenorhabditis elegans remains incomplete despite its sequencing 20 years ago. The last decade of research has seen a tremendous increase in the number of non-coding RNAs identified in various organisms. While we have mechanistic understandings of small non-coding RNA pathways, long non-coding RNAs represent a diverse class of active transcripts whose function remains less well characterised.
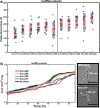
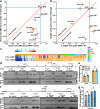
Results: By analysing hundreds of published transcriptome datasets, we annotated 3392 potential lncRNAs including 143 multi-exonic loci that showed increased nucleotide conservation and GC content relative to other non-coding regions. Using CRISPR/Cas9 genome editing, we generated deletion mutants for ten long non-coding RNA loci. Using automated microscopy for in-depth phenotyping, we show that six of the long non-coding RNA loci are required for normal development and fertility. Using RNA interference-mediated gene knock-down, we provide evidence that for two of the long non-coding RNA loci, the observed phenotypes are dependent on the corresponding RNA transcripts.
Conclusions: Our results highlight that a large section of the non-coding regions of the C. elegans genome remains unexplored. Based on our in vivo analysis of a selection of high-confidence lncRNA loci, we expect that a significant proportion of these high-confidence regions is likely to have a biological function at either the genomic or the transcript level.
Keywords: C. elegans; CRISPR; Long non-coding RNA; Non-coding; lincRNA; lncRNA.
Conflict of interest statement
Ethics approval and consent to participate
Not applicable.
Competing interests
The authors declare that they have no competing interests. The datasets supporting the conclusions of this article are available in the NCBI SRA repository (
Publisher’s Note
Springer Nature remains neutral with regard to jurisdictional claims in published maps and institutional affiliations.
Figures


Similar articles
-
Systematic analysis of long intergenic non-coding RNAs in C. elegans germline uncovers roles in somatic growth.RNA Biol. 2021 Mar;18(3):435-445. doi: 10.1080/15476286.2020.1814549. Epub 2020 Sep 5. RNA Biol. 2021. PMID: 32892705 Free PMC article.
-
Integrative transcriptome analysis suggest processing of a subset of long non-coding RNAs to small RNAs.Biol Direct. 2012 Aug 7;7:25. doi: 10.1186/1745-6150-7-25. Biol Direct. 2012. PMID: 22871084 Free PMC article.
-
Characterisation of Caenorhabditis elegans sperm transcriptome and proteome.BMC Genomics. 2014 Feb 28;15:168. doi: 10.1186/1471-2164-15-168. BMC Genomics. 2014. PMID: 24581041 Free PMC article.
-
Molecular functions and biological roles of long non-coding RNAs in human physiology and disease.J Gene Med. 2019 Aug;21(8):e3104. doi: 10.1002/jgm.3104. Epub 2019 Jul 1. J Gene Med. 2019. PMID: 31177599 Review.
-
The applications of CRISPR/Cas-mediated microRNA and lncRNA editing in plant biology: shaping the future of plant non-coding RNA research.Planta. 2023 Dec 28;259(2):32. doi: 10.1007/s00425-023-04303-z. Planta. 2023. PMID: 38153530 Review.
Cited by
-
Systematic analysis of long intergenic non-coding RNAs in C. elegans germline uncovers roles in somatic growth.RNA Biol. 2021 Mar;18(3):435-445. doi: 10.1080/15476286.2020.1814549. Epub 2020 Sep 5. RNA Biol. 2021. PMID: 32892705 Free PMC article.
-
Non-Coding RNAs in Caenorhabditis elegans Aging.Mol Cells. 2019 May 31;42(5):379-385. doi: 10.14348/molcells.2019.0077. Mol Cells. 2019. PMID: 31094164 Free PMC article. Review.
-
LncRNAs Are Differentially Expressed between Wildtype and Cell Line Strains of African Trypanosomes.Noncoding RNA. 2022 Jan 12;8(1):7. doi: 10.3390/ncrna8010007. Noncoding RNA. 2022. PMID: 35076577 Free PMC article.
-
Expression of Transposable Elements throughout the Fasciola hepatica Trematode Life Cycle.Noncoding RNA. 2024 Jul 3;10(4):39. doi: 10.3390/ncrna10040039. Noncoding RNA. 2024. PMID: 39051373 Free PMC article.
-
LncRNA Functional Screening in Organismal Development.Noncoding RNA. 2023 Jun 28;9(4):36. doi: 10.3390/ncrna9040036. Noncoding RNA. 2023. PMID: 37489456 Free PMC article. Review.
References
Publication types
MeSH terms
Substances
Grants and funding
- 18583/CRUK_/Cancer Research UK/United Kingdom
- 104640/Z/14/Z/WT_/Wellcome Trust/United Kingdom
- 092096/Z/10/Z/WT_/Wellcome Trust/United Kingdom
- BBS/E/T/000PR9783/BB_/Biotechnology and Biological Sciences Research Council/United Kingdom
- MR/P026028/1/MRC_/Medical Research Council/United Kingdom
- BBS/E/T/000PR9818/BB_/Biotechnology and Biological Sciences Research Council/United Kingdom
- C13474/A18583/CRUK_/Cancer Research UK/United Kingdom
- WT_/Wellcome Trust/United Kingdom
- C6946/A14492/CRUK_/Cancer Research UK/United Kingdom
- MC_UU_00007/15/MRC_/Medical Research Council/United Kingdom
- MC_UU_12008/1/MRC_/Medical Research Council/United Kingdom
- 104640/Z/14/Z/WT_/Wellcome Trust/United Kingdom
- BBS/E/T/000PR9817/BB_/Biotechnology and Biological Sciences Research Council/United Kingdom
LinkOut - more resources
Full Text Sources
Miscellaneous

