O-GlcNAc Transferase Suppresses Inflammation and Necroptosis by Targeting Receptor-Interacting Serine/Threonine-Protein Kinase 3
- PMID: 30770249
- PMCID: PMC6426684
- DOI: 10.1016/j.immuni.2019.01.007
O-GlcNAc Transferase Suppresses Inflammation and Necroptosis by Targeting Receptor-Interacting Serine/Threonine-Protein Kinase 3
Erratum in
-
O-GlcNAc Transferase Suppresses Inflammation and Necroptosis by Targeting Receptor-Interacting Serine/Threonine-Protein Kinase 3.Immunity. 2019 Apr 16;50(4):1115. doi: 10.1016/j.immuni.2019.03.008. Immunity. 2019. PMID: 30995496 Free PMC article. No abstract available.
Abstract
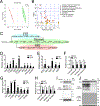
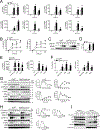
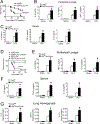
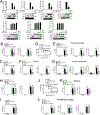
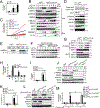
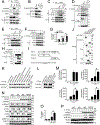
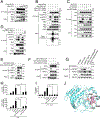
Elevated glucose metabolism in immune cells represents a hallmark feature of many inflammatory diseases, such as sepsis. However, the role of individual glucose metabolic pathways during immune cell activation and inflammation remains incompletely understood. Here, we demonstrate a previously unrecognized anti-inflammatory function of the O-linked β-N-acetylglucosamine (O-GlcNAc) signaling associated with the hexosamine biosynthesis pathway (HBP). Despite elevated activities of glycolysis and the pentose phosphate pathway, activation of macrophages with lipopolysaccharide (LPS) resulted in attenuated HBP activity and protein O-GlcNAcylation. Deletion of O-GlcNAc transferase (OGT), a key enzyme for protein O-GlcNAcylation, led to enhanced innate immune activation and exacerbated septic inflammation. Mechanistically, OGT-mediated O-GlcNAcylation of the serine-threonine kinase RIPK3 on threonine 467 (T467) prevented RIPK3-RIPK1 hetero- and RIPK3-RIPK3 homo-interaction and inhibited downstream innate immunity and necroptosis signaling. Thus, our study identifies an immuno-metabolic crosstalk essential for fine-tuning innate immune cell activation and highlights the importance of glucose metabolism in septic inflammation.
Keywords: HBP; O-GlcNAc; OGT; RIPK3; inflammation; necroptosis.
Copyright © 2019 Elsevier Inc. All rights reserved.
Conflict of interest statement
Figures
Comment in
-
Sugar Fix Keeps RIPK3 at Bay.Immunity. 2019 Mar 19;50(3):539-541. doi: 10.1016/j.immuni.2019.02.018. Immunity. 2019. PMID: 30893581
Similar articles
-
Sevoflurane postconditioning reduces myocardial ischemia reperfusion injury-induced necroptosis by up-regulation of OGT-mediated O-GlcNAcylated RIPK3.Aging (Albany NY). 2020 Nov 20;12(24):25452-25468. doi: 10.18632/aging.104146. Epub 2020 Nov 20. Aging (Albany NY). 2020. PMID: 33231560 Free PMC article.
-
O-GlcNAc Transferase Links Glucose Metabolism to MAVS-Mediated Antiviral Innate Immunity.Cell Host Microbe. 2018 Dec 12;24(6):791-803.e6. doi: 10.1016/j.chom.2018.11.001. Cell Host Microbe. 2018. PMID: 30543776 Free PMC article.
-
Hexosamine biosynthetic pathway promotes the antiviral activity of SAMHD1 by enhancing O-GlcNAc transferase-mediated protein O-GlcNAcylation.Theranostics. 2021 Jan 1;11(2):805-823. doi: 10.7150/thno.50230. eCollection 2021. Theranostics. 2021. PMID: 33391506 Free PMC article.
-
RIPK1 and RIPK3: critical regulators of inflammation and cell death.Trends Cell Biol. 2015 Jun;25(6):347-53. doi: 10.1016/j.tcb.2015.01.001. Epub 2015 Feb 4. Trends Cell Biol. 2015. PMID: 25662614 Review.
-
Protein O-GlcNAcylation and the regulation of energy homeostasis: lessons from knock-out mouse models.J Biomed Sci. 2022 Sep 4;29(1):64. doi: 10.1186/s12929-022-00851-w. J Biomed Sci. 2022. PMID: 36058931 Free PMC article. Review.
Cited by
-
O-GlcNAcylation: Crosstalk between Hemostasis, Inflammation, and Cancer.Int J Mol Sci. 2024 Sep 13;25(18):9896. doi: 10.3390/ijms25189896. Int J Mol Sci. 2024. PMID: 39337387 Free PMC article. Review.
-
Inhibition of O-GlcNAc transferase activates type I interferon-dependent antitumor immunity by bridging cGAS-STING pathway.bioRxiv [Preprint]. 2024 Jun 11:2023.12.14.571787. doi: 10.1101/2023.12.14.571787. bioRxiv. 2024. Update in: Elife. 2024 Oct 04;13:RP94849. doi: 10.7554/eLife.94849 PMID: 38168435 Free PMC article. Updated. Preprint.
-
Editorial: Necroptosis: from bench to bedside.Front Immunol. 2024 Jun 19;15:1441901. doi: 10.3389/fimmu.2024.1441901. eCollection 2024. Front Immunol. 2024. PMID: 38962001 Free PMC article. No abstract available.
-
Chronically Elevated O-GlcNAcylation Limits Nitric Oxide Production and Deregulates Specific Pro-Inflammatory Cytokines.Front Immunol. 2022 Apr 1;13:802336. doi: 10.3389/fimmu.2022.802336. eCollection 2022. Front Immunol. 2022. PMID: 35432339 Free PMC article.
-
O-GlcNAcylation: The Underestimated Emerging Regulators of Skeletal Muscle Physiology.Cells. 2022 May 30;11(11):1789. doi: 10.3390/cells11111789. Cells. 2022. PMID: 35681484 Free PMC article. Review.
References
-
- Alvarez-Diaz S, Dillon CP, Lalaoui N, Tanzer MC, Rodriguez DA, Lin A, Lebois M, Hakem R, Josefsson EC, O’Reilly LA, et al. (2016). The Pseudokinase MLKL and the Kinase RIPK3 Have Distinct Roles in Autoimmune Disease Caused by Loss of Death-Receptor-Induced Apoptosis. Immunity 45, 513–526. - PMC - PubMed
-
- Berger SB, Kasparcova V, Hoffman S, Swift B, Dare L, Schaeffer M, Capriotti C, Cook M, Finger J, Hughes-Earle A, et al. (2014). Cutting Edge: RIP1 kinase activity is dispensable for normal development but is a key regulator of inflammation in SHARPIN-deficient mice. J Immunol 192, 5476–5480. - PMC - PubMed
Publication types
MeSH terms
Substances
Grants and funding
- R01 CA216853/CA/NCI NIH HHS/United States
- P30 CA016086/CA/NCI NIH HHS/United States
- C06 RR015468/RR/NCRR NIH HHS/United States
- R35 CA231620/CA/NCI NIH HHS/United States
- R01 CA210439/CA/NCI NIH HHS/United States
- R01 DE026728/DE/NIDCR NIH HHS/United States
- P30 GM103335/GM/NIGMS NIH HHS/United States
- R00 DE024173/DE/NIDCR NIH HHS/United States
- R01 AI044828/AI/NIAID NIH HHS/United States
- P01 CA120964/CA/NCI NIH HHS/United States
- P20 GM113126/GM/NIGMS NIH HHS/United States
- R01 CA169291/CA/NCI NIH HHS/United States
- R01 GM120496/GM/NIGMS NIH HHS/United States
- R01 CA163649/CA/NCI NIH HHS/United States
- R01 DK102648/DK/NIDDK NIH HHS/United States
- R37 AI044828/AI/NIAID NIH HHS/United States
- P30 CA006516/CA/NCI NIH HHS/United States
LinkOut - more resources
Full Text Sources
Molecular Biology Databases
Research Materials
Miscellaneous

