. 2019 Apr;95(4):361-375.
doi: 10.1124/mol.118.114710. Epub 2019 Feb 14.

Statins Perturb G βγ Signaling and Cell Behavior in a G γ Subtype Dependent Manner

Affiliations

Statins Perturb G βγ Signaling and Cell Behavior in a G γ Subtype Dependent Manner

Mithila Tennakoon et al. Mol Pharmacol. 2019 Apr.

Abstract

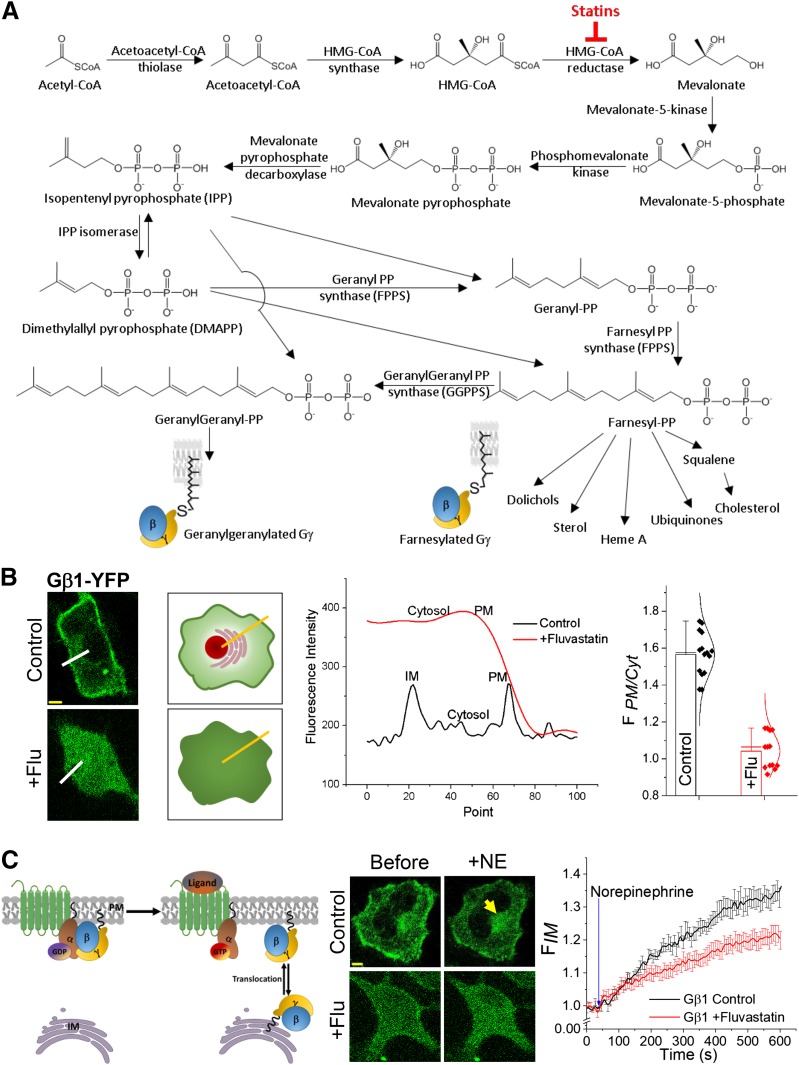
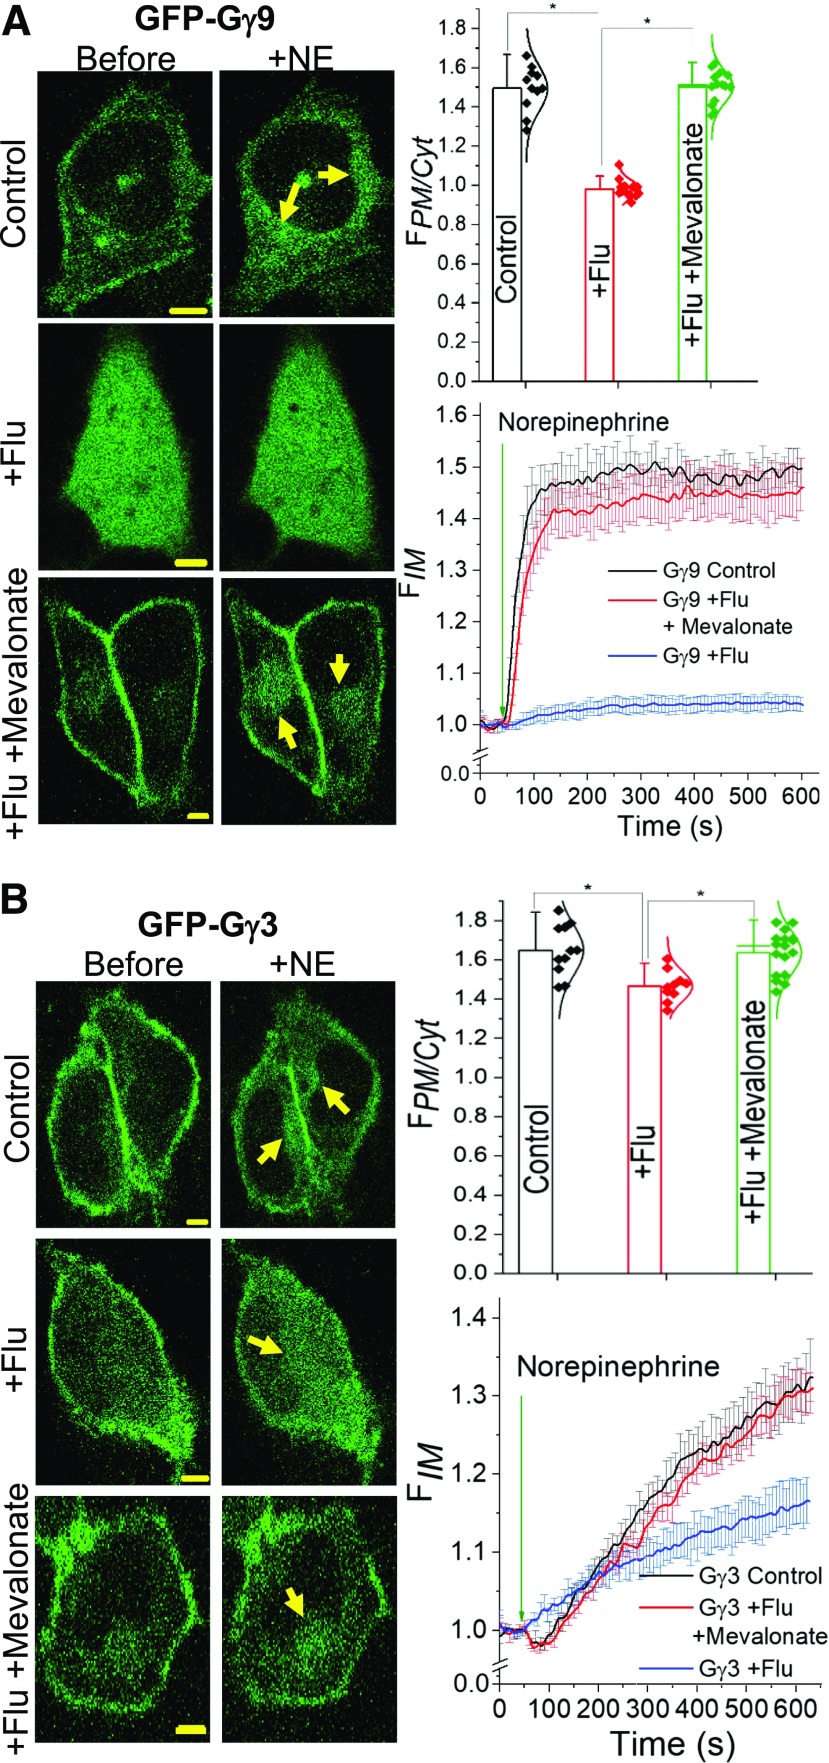
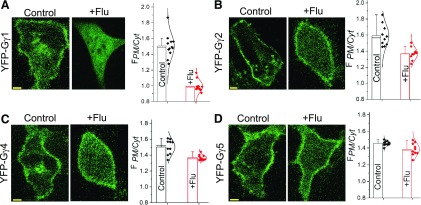
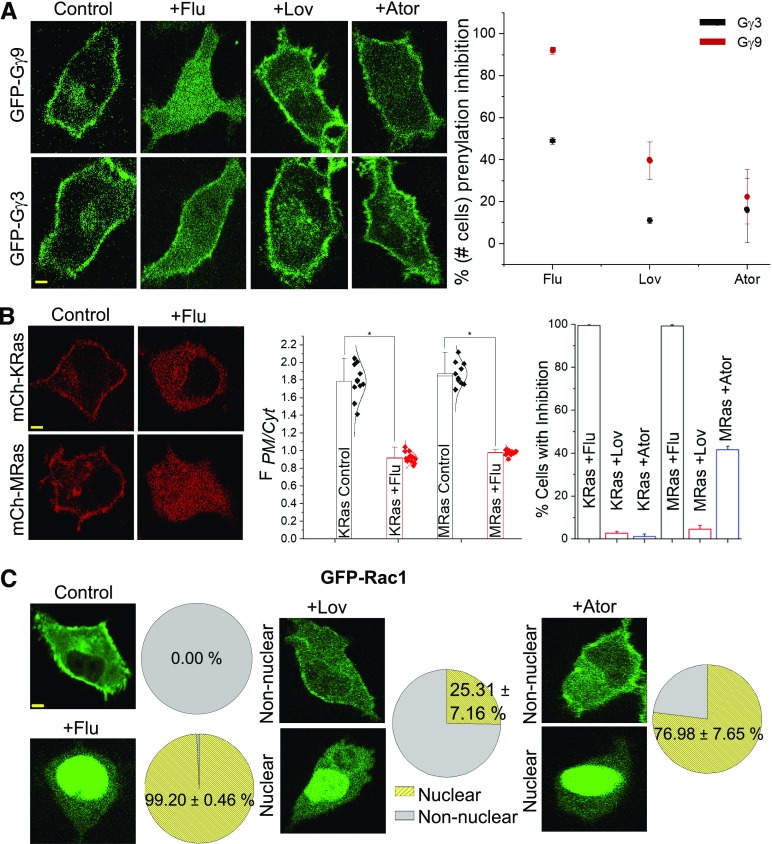
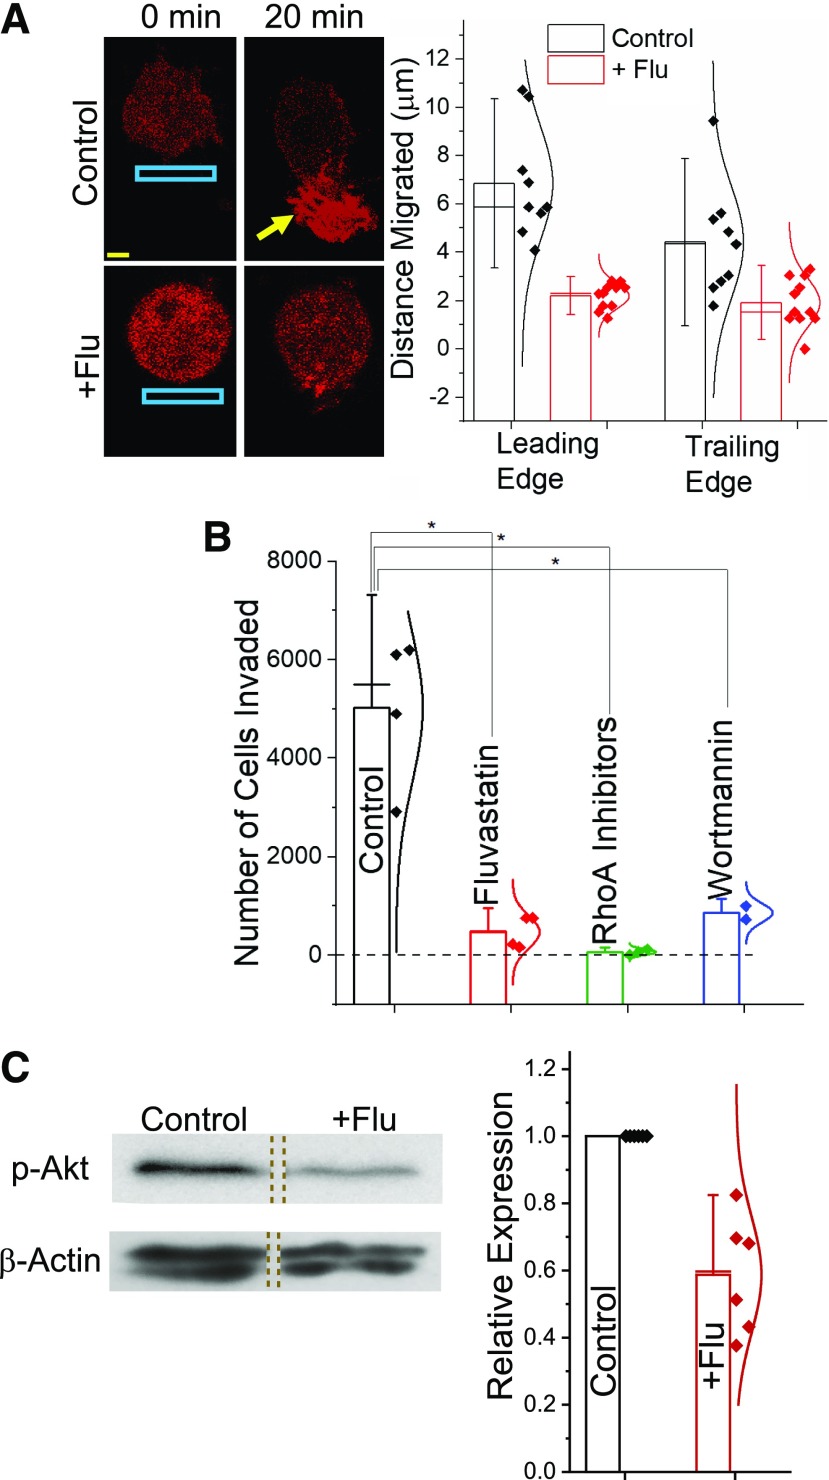
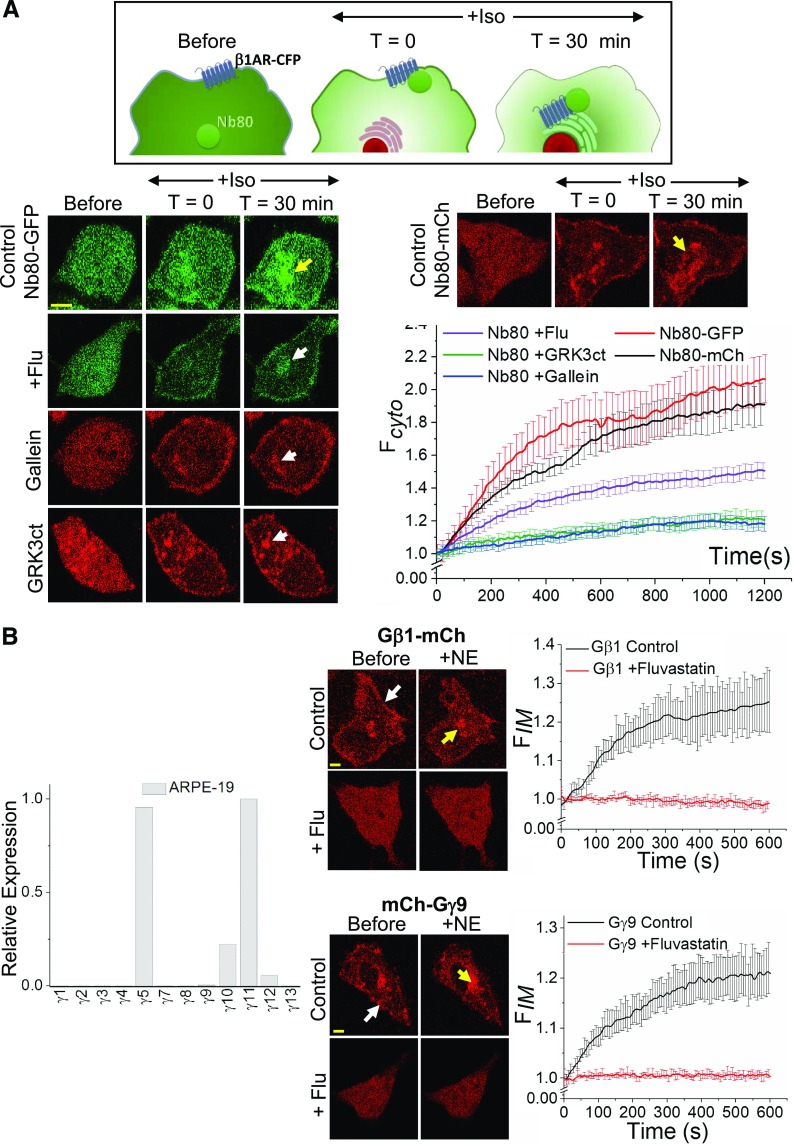
Guanine nucleotide-binding proteins (G proteins) facilitate the transduction of external signals to the cell interior, regulate most eukaryotic signaling, and thus have become crucial disease drivers. G proteins largely function at the inner leaflet of the plasma membrane (PM) using covalently attached lipid anchors. Both small monomeric and heterotrimeric G proteins are primarily prenylated, either with a 15-carbon farnesyl or a 20-carbon geranylgeranyl polyunsaturated lipid. The mevalonate [3-hydroxy-3-methylglutaryl-coenzyme A (HMG-CoA) reductase] pathway synthesizes lipids for G-protein prenylation. It is also the source of the precursor lipids for many biomolecules, including cholesterol. Consequently, the rate-limiting enzymes of the mevalonate pathway are major targets for cholesterol-lowering medications and anticancer drug development. Although prenylated G protein γ (Gγ) is essential for G protein-coupled receptor (GPCR)-mediated signaling, how mevalonate pathway inhibitors, statins, influence subcellular distribution of Gβγ dimer and Gαβγ heterotrimer, as well as their signaling upon GPCR activation, is poorly understood. The present study shows that clinically used statins not only significantly disrupt PM localization of Gβγ but also perturb GPCR-G protein signaling and associated cell behaviors. The results also demonstrate that the efficiency of prenylation inhibition by statins is Gγ subtype-dependent and is more effective toward farnesylated Gγ types. Since Gγ is required for Gβγ signaling and shows a cell- and tissue-specific subtype distribution, the present study can help understand the mechanisms underlying clinical outcomes of statin use in patients. This work also reveals the potential of statins as clinically usable drugs to control selected GPCR-G protein signaling.


Figures

Fig. 1.
Fig. 1.
G-protein prenylation and fluvastatin induced inhibition of Gβ1γ localization on the PM. (A) Major steps of the hepatic cholesterol biosynthesis/mevalonate pathway. By inhibiting the rate-limiting step enzyme HMG-CoA reductase, statins reduce the biosynthesis of many lipids, including cholesterol. (B) Quantification of statin-mediated inhibition of G-protein PM localization in living cells. Images of HeLa cells expressing Gβ1-YFP. Cells treated with 2 μM fluvastatin exhibited a complete cytosolic distribution of Gβ1, whereas control cells showed primarily PM- and IM-localized Gβ1-YFP. Cartoon shows how the line-profile data were obtained to calculate the G proteins distribution ratio (FPM/Cytosol) in control and Fluvastatin-treated cells. Bar graph shows FPM/Cytosol < 1.0 for fluvastatin treated cells since Gβ1 is cytosolic, likely because of a lack of prenylation (error bars: S.E.M., n = 12 cells, P < 0.05). (C) Left: GPCR activation induced translocation of Gβγ dimer from the PM to IMs. In the GPCR-inactive state, G-protein heterotrimers reside on the PM, and upon activation, heterotrimers dissociate, generating Gα-GTP and free Gβγ. The resultant Gβγ then can translocate from the PM to IMs in a Gγ-type–dependent manner. Middle: Images show translocation of Gβ1 in control HeLa cells upon activation of endogenous α2-AR with 100 μM norepinephrine (NE). Fluvastatin-treated cells exhibited ∼50% attenuated translocation. Right: The plot shows the translocation dynamics of Gβ1. Yellow arrows indicate translocated Gβ1 on IMs (scale bar, 5 μm, error bars: S.E.M., n = 20 cells, two-tailed t test was performed after the time point the response reached equilibrium; data are statistically significant at the 0.0001 level).
Fig. 2.
Fig. 2.
Fluvastatin differentially attenuates the PM localization of Gγ9 and Gγ3. (A) Images of control cells pretreated with the carrier solvent (DMSO) exhibited a clear distribution of GFP-Gγ9 on the PM, indicating prenylated Gγ9. Fluvastatin-treated cells showed near-complete cytosolic GFP-Gγ9, suggesting a complete inhibition of Gγ9 prenylation. +Flu + mevalonate cells show that supplementation of mevalonate abrogates fluvastatin action. Bar graphs show that of +flu cells with FPM/Cytosol ≤ 1, exhibiting lack of GFP fluorescence on the PM; both control and +flu + mevalonate cells with FPM/Cytosol > 1 indicating the PM-bound GFP fluorescence. Images (left) and the plot show endogenous α2-AR activation mediated Gγ9 translocation only in control and +flu + mevalonate cells. The t statistics show that at P < 0.05, mean FPM/Cytosol are not significantly different for control and +flu +mevalonate cells. In contrast, translocation in Fluvastatin-treated cells were significantly attenuated, indicating a lack of PM-bound heterotrimers (error bars: S.E.M., n = 12 cells; two-tailed t test was performed after the time point the response reached equilibrium, and the data are statistically significant at 0.05 level). (B) Partial prenylation inhibition of GFP-Gγ3 in HeLa cells. Like GFP-Gγ9-expressing cells, control and +flu + mevalonate cells showed that GFP-Gγ3 is on the PM. In contrast to Gγ9, +flu cells showed GFP-Gγ3 distribution only on the PM, whereas no Gγ3 residing in IMs is observed. Upon endogenous α2-AR activation, cells in all three conditions exhibited translocation. The plot (right) shows a ∼1/3 magnitude lower translocation in +flu cells compared with controls and +flu + mevalonate cells, which indicates that fluvastatin can attenuate Gβγ3 activation. Yellow arrows indicate Gβγ translocated to IMs (Scale bar, 5 μm, error bars: S.E.M., n = 15 cells; two- tailed t test was performed after the time point the response reached equilibrium, and the data are statistically significant at the 0.05 level).
Fig. 3.
Fig. 3.
Fluvastatin has distinct inhibition abilities of membrane localization of Gγ1, Gγ2, Gγ4, and Gγ5. HeLa cells expressing (A) YFP-Gγ1 (B) YFP-Gγ2 (C) YFP-Gγ4 and (D) YFP-Gγ5, pretreated overnight with 2 μM fluvastatin during transfection. Control cells showed a clear localization of Gγ on the PMs and in IMs. Fluvastatin-treated cells showed a complete cytosolic distribution of Gγ1-, Gγ2-, Gγ4-, and Gγ5-transfected cells exposed to fluvastatin and showed only a partial presence of YFP in the cytosol, similar to GFP-Gγ3 cells exposed to fluvastatin. Bar graphs show FPM/Cytosol in control and +flu cells in which Gγ1, Gγ2, and Gγ4 show a significant increase in cytosolic YFP compared with control cells; however, no significant difference in FPM/Cytosol of Gγ5 cells was observed between control and +flu conditions. (Scale bar, 5 μm, error bars: S.D., 10 < n < 15 cells, P < 0.05).
Fig. 4.
Fig. 4.
Different statins show distinct inhibitions of the PM localization of the same G protein. (A) Compared with Fluvastatin-treated cells, HeLa cells expressing GFP-Gγ9 and GFP-Gγ3 treated with either lovastatin or atorvastatin only exhibited a minor inhibition of the Gγ-PM localization. The plot shows the percentage of cells that showed at least partial membrane localization inhibition in the GFP-Gγ–expressing cell populations. Symbols ■, ٭ and • on the plot indicate complete, moderate, and minor inhibitions respectively (10 < n < 30 cells). A two-way ANOVA shows that Gγ3 and Gγ9 significantly differ, F (1,12) = 41.2, P < 0.05, such that the average inhibition was significantly higher for Gγ9 (M = 51.2%, S.E.M. = 10.8) than for Gγ3 (M = 22.8%, S.E.M. = 5.4). The inhibitory effect on Gγ membrane interactions of drugs were also significant, F (2, 12) = 63.2, P > 0.05 such that +flu effect was significantly higher (M = 74.6%, S.E.M. = 10.5), compared with Ator (M = 28.1%, S.E.M. = 7.5) and lovastatin (M = 19.0%, S.E.M. = 3.4). (B) HeLa cells expressing mCh-KRas and mCh-MRas pretreated with either DMSO (control) or fluvastatin. Compared with control cells, both KRas and MRas in +flu cells showed a complete cytosolic fluorescence distribution, indicating the near-complete inhibition of their farnesylation. Bar graph (middle) with FPM/Cytosol indicates significant differences in inhibitions between control and +flu cells in both KRas and MRas cells. Bar graph (right) with percentage of the number of cells with PM localization. +Flu shows effective inhibitions of both Ras members; atorvastatin shows ∼40% inhibition of MRas and near-zero inhibition of KRas. + Lovastatin exhibited minor inhibition of both Ras members (scale bar, 5 μm, error bars: S.E.M., n = 17 cells, P < 0.05). (C) HeLa cells expressing GFP-Rac1 showed a clear PM localization; +flu cells showed GFP fluorescence primarily in the nucleus. +Lov and +Ator treatments induced bi-phasic responses, i.e., only a fraction of cell population exhibited complete nuclear localization of Rac1 (scale bar, 5 μm, error bars: S.E.M., n ≥ 15 cells, P < 0.05).
Fig. 5.
Fig. 5.
Fluvastatin perturbs Gβγ signaling in RAW 264.7 macrophages. (A) Upon activation of endogenous c5a receptor with 20 μM c5a, 55% of control (DMSO-treated) RAW 264.7 cells exhibited increase in fluo-4 fluorescence (green), indicating cellular calcium increase. By contrast, only ∼11% of 10 μM Fluvastatin-treated cells showed weaker calcium responses. The plot compares representative calcium responses by a control and +flu cell. Bar graph shows that, compared with control cells, +flu, +ator-, and +lov-treated cells exhibited varying levels of calcium-response inhibitions; however, the +ator cells were not significantly different from the responses of control cells (scale bar, 10 μm, number of fields ≥6, n < 30 cells in each field, error bars: S.D., P < 0.05). (B) RAW 264.7 cells expressing blue opsin-mTurquoise (Gi-coupled GPCR), Akt-PH-mCh (PIP3 sensor), and either GFP-GPI or GFP-Gγ3 preincubated with 50 μM 11-cis-retinal. Both WT control and GFP-Gγ3 cells showed PIP3 generation, indicated by the translocation of cytosolic Akt-PH-mCh to the PM (yellow arrow). Fluvastatin exhibited the highest inhibition in both WT control and GFP-Gγ3–expressing cells. Plots and a two-way ANOVA showed that the PIP3 production inhibitions by all three drugs are statistically significant (scale bar, 5 μm, error bars: S.E.M., n ≥ 15 cells, P < 0.05).
Fig. 6.
Fig. 6.
Fluvastatin attenuates Gi-pathway–governed cell migration and invasion and reduces Akt phosphorylation. (A) A RAW 264.7 cell-expressing blue opsin-mTurquoise and Akt-PH-mCh and incubated with 50 μM 11-cis-retinal exhibited a directional migration toward the optical stimuli upon localized optical activation of blue opsin (blue box). This migration is accompanied with lamellipodia and clear generation of PIP3 at the leading edge. In contrast, cells treated with 10 μM fluvastatin exhibited a significant reduction (P < 0.05) in cell migration, lamellipodia formation, and PIP3 generation (error bars: S.D., n > 10 cells, P < 0.05). (B) Bar graph shows invasion of RAW 264.7 cells in the transwell invasion assay, induced by endogenous c5a receptor activation using 12.5 μM c5a. Compared with control (DMSO) cells, fluvastatin, RhoA inhibitors (EHop-016, EHT1864, and GSK269962), and PI3K inhibitor (wortmannin)-treated cells exhibited significant reductions in cell invasion (n = 2). Compared with wortmannin-treated cells, Fluvastatin-treated cells exhibited ∼50% more inhibition, indicating that inhibition through fluvastatin can be due to prenylation inhibition of both Gγ as well as Ras family proteins (error bars: S.D., n < 3 independent experiments, P < 0.05). (C) Examination of Akt phosphorylation in cells exposed to fluvastatin using Western blot analysis. Images and bar graph show ∼40% less Akt phosphorylation in +flu cells, compared with control cells. Protein expressions were normalized to both total Akt and β-Actin. (error bars: S.D., n = three independent experiments, P < 0.05).
Fig. 7.
Fig. 7.
Fluvastatin (A) attenuates internalization of activated ß1-adrenergic receptors in HeLa cells and (B) impairs Gβγ-mediated signaling in ARPE-19 cells. (A) The schematic representation of Nb80 translocation to activated β1-AR and its subsequent internalization with the receptor. Images show the Nb80-GFP movement in HeLa cells expressing β1-AR-CFP upon receptor activation. After activation of β1-AR with 20 μM isoproterenol, control cells showed a robust recruitment of Nb80 (both GFP and mCh tagged) to the IMs with the internalized and active β1-AR (top image panel, yellow arrows). A comparatively reduced Nb80 recruitment was observed in +flu cells (second panel right, white arrow). The plot shows ∼50% reduced mean GFP fluorescence of Nb80 in the IMs in Fluvastatin-treated cells, indicating attenuated β1-AR desensitization (n = 20 cells from four independent experiments). Both 10 μM gallein (Gβγ inhibitor)-treated cells (third panel right, white arrow) and membrane-targeted venus-GRK3ct (mask Gβγ) expressing cells showed ∼80% lower Nb80 accumulation in IMs (white arrows), indicating the involvement of Gβγ in the pathway. Both Nb80-GFP and -mCh versions exhibited similar internalization in control cells (red and black curves respectively). (B) Real-time PCR quantification of relative expression levels of the 12 Gγ subtypes in ARPE-19 cells. Farnesylated Gγ11 showed the highest expression. Images show ARPE-19 cells expressing blue opsin-mTurquoise with either Gβ1-mCh or mCh-Gγ9 and incubated with 50 μM 11-cis-retinal. Gβ1 and Gγ9 in control cells were found primarily on the PM (white arrows), and upon blue opsin activation, both proteins exhibited robust translocations from the PMs to IMs (yellow arrows). Likely because of prenylation inhibition, both Gβ1 and Gγ9 distribution in +flu cells were completely cytosolic, and their translocations upon blue opsin activation were not detected. Collectively, these data indicate the lack of prenylation of endogenous Gγ types as well as transfected Gγ9 upon fluvastatin treatment. (Scale bar, 5 μm, error bars: S.E.M., n = 16 cells, P < 0.05).

Similar articles

Cited by

References

    1. Ajith Karunarathne WK, O’Neill PR, Martinez-Espinosa PL, Kalyanaraman V, Gautam N. (2012) All G protein βγ complexes are capable of translocation on receptor activation. Biochem Biophys Res Commun 421:605–611. - PMC - PubMed
    1. Alberts AW. (1988) Discovery, biochemistry and biology of lovastatin. Am J Cardiol 62:10J–15J. - PubMed
    1. Bathgate-Siryk A, Dabul S, Pandya K, Walklett K, Rengo G, Cannavo A, De Lucia C, Liccardo D, Gao E, Leosco D, et al. (2014) Negative impact of β-arrestin-1 on post-myocardial infarction heart failure via cardiac and adrenal-dependent neurohormonal mechanisms. Hypertension 63(2):404–412. - PMC - PubMed
    1. Berndt N, Hamilton AD, Sebti SM. (2011) Targeting protein prenylation for cancer therapy. Nat Rev Cancer 11:775–791. - PMC - PubMed
    1. Braselmann S, Palmer TM, Cook SJ. (1997) Signalling enzymes: bursting with potential. Curr Biol 7:R470–R473. - PubMed

Publication types

MeSH terms

Substances