. 2019 Mar 21;73(6):1292-1305.e8.
doi: 10.1016/j.molcel.2019.01.009. Epub 2019 Feb 12.

Unravelling Intratumoral Heterogeneity through High-Sensitivity Single-Cell Mutational Analysis and Parallel RNA Sequencing

Affiliations

Unravelling Intratumoral Heterogeneity through High-Sensitivity Single-Cell Mutational Analysis and Parallel RNA Sequencing

Alba Rodriguez-Meira et al. Mol Cell. .

Abstract

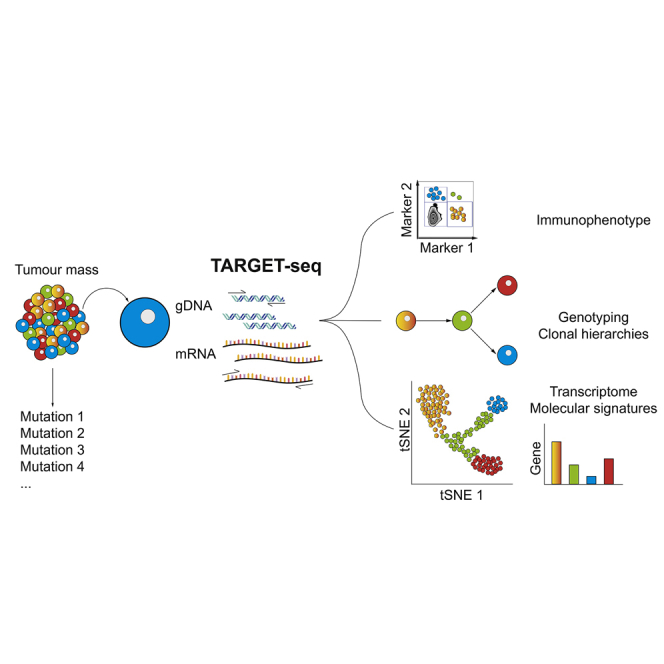
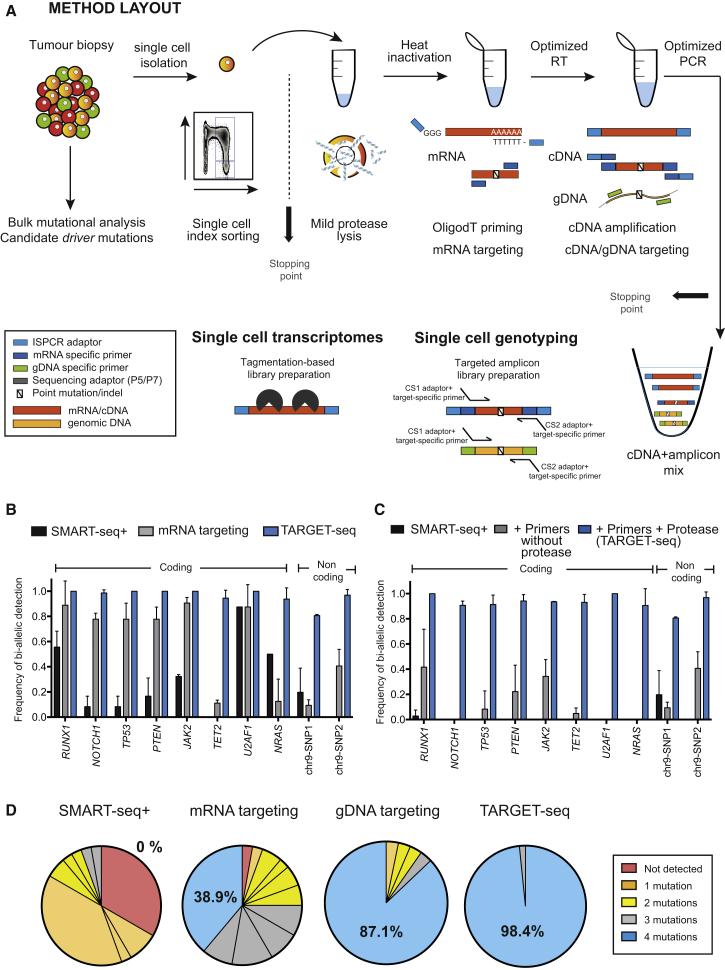
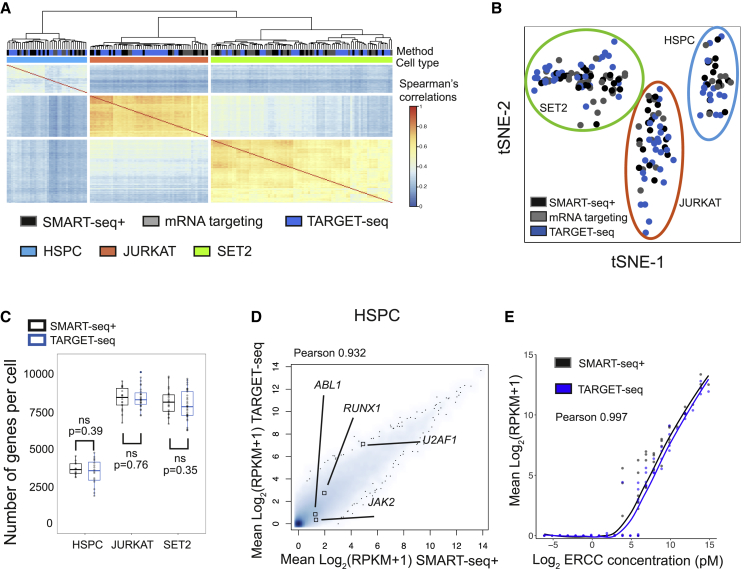
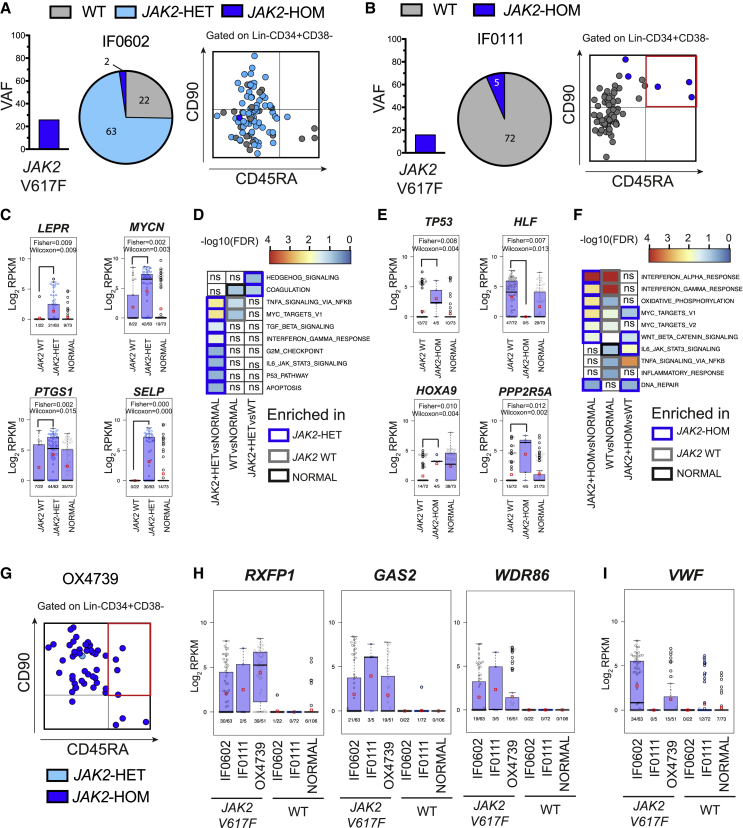
Single-cell RNA sequencing (scRNA-seq) has emerged as a powerful tool for resolving transcriptional heterogeneity. However, its application to studying cancerous tissues is currently hampered by the lack of coverage across key mutation hotspots in the vast majority of cells; this lack of coverage prevents the correlation of genetic and transcriptional readouts from the same single cell. To overcome this, we developed TARGET-seq, a method for the high-sensitivity detection of multiple mutations within single cells from both genomic and coding DNA, in parallel with unbiased whole-transcriptome analysis. Applying TARGET-seq to 4,559 single cells, we demonstrate how this technique uniquely resolves transcriptional and genetic tumor heterogeneity in myeloproliferative neoplasms (MPN) stem and progenitor cells, providing insights into deregulated pathways of mutant and non-mutant cells. TARGET-seq is a powerful tool for resolving the molecular signatures of genetically distinct subclones of cancer cells.

Keywords: Heterogeneity; TARGET-seq; cancer; hematopoiesis; leukemia; mutations; myeloproliferative neoplasm; sequencing; single-cell; transcriptomics.


Figures

None
Graphical abstract
Figure 1
Figure 1
TARGET-Seq: A Method for High-Sensitivity Mutation Detection and Parallel Whole-Transcriptome Analysis from the Same Single Cell (A) Schematic representation of the method (full details are available in STAR Methods and Supplemental Experimental Procedures). In brief, cells were sorted into plates containing TARGET-seq lysis buffer; after lysis, protease was heat inactivated. RT mix was then added. OligodT-ISPCR primed polyadenylated mRNA and target-specific primers primed mRNA molecules of interest. During subsequent PCR, we used ISPCR adaptors to amplify polyA-cDNA, and we used target-specific cDNA and gDNA primers to amplify amplicons of interest. An aliquot of the resulting cDNA+amplicon mix was used for preparing the genotyping library and another aliquot for preparing the transcriptome library for scRNA-seq. (B) Frequency with which TARGET-seq detected heterozygous mutations in ten coding and non-coding regions in cell lines; this approach is compared to SMART-seq+ and mRNA targeting approaches (n = 376 cells, 2–3 independent experiments per amplicon; the bar graph represents mean ± SD). (C) Frequency of detection of heterozygous mutations for the same amplicons as in (B), showing exclusively results from targeted genomic DNA sequencing. The bar graph represents mean ± SD. (D) Frequency of detection of heterozygous mutations in JURKAT cells with SMART-seq+ (n = 36 cells), mRNA targeting (n = 36 cells), gDNA targeting (n = 62 cells), and TARGET-seq (n = 62 cells) when four different mutations (RUNX1, NOTCH1, PTEN, and TP53) in the same single cell were profiled in three independent experiments. Each slice of the pie chart represents a different combination of mutations, and each color represents the number of mutations detected per single cell.
Figure 2
Figure 2
Unbiased Whole-Transcriptome Analysis of Single Cells with TARGET-Seq (A) Unsupervised hierarchical clustering of Spearman’s correlations from 180 single cells (JURKAT, n = 56; SET2, n = 86; and HSPC, n = 38); 4,088 highly variable genes were used. scRNA-seq libraries were generated with SMART-seq+, mRNA targeting, or TARGET-seq as indicated. (B) tSNE representation of HSPCs, SET2 cells, and JURKAT cells from (A); the same 4,088 highly variable genes as in (A) were used. (C) Number of detected genes per cell (RPKM ≥ 1) in HSPCs, SET2, and JURKAT cell lines from SMART-seq+ or TARGET-seq. “p” indicates the Student’s-t-test p value, and “ns” = non-significance. The boxes represent median and quartiles, and the dots represent the value for each individual cell. (D) Whole-transcriptome Pearson’s correlation between SMART-seq+ and TARGET-seq ensembles (mean RPKM values per condition) in HSPCs. The expression values for the genes targeted are highlighted. (E) Pearson’s correlation between mean ERCC spike-in expression values from SMART-seq+ and TARGET-seq in HSPCs per ERCC spike-in concentration.
Figure 3
Figure 3
TARGET-Seq Reveals Genetic and Transcriptional Heterogeneity in the Stem-Cell Compartment of Patients with MPN (A and B) Variant allele frequency of JAK2V617F mutation (left), as identified by bulk sequencing of total MNCs; proportion of single cells that carry the mutation (including zygosity) in the Lin-CD34+CD38- compartment (center); and integration of index sorting with mutational information (right) for patients IF0602 (A) and IF0111 (B). (C–F) Analysis of disrupted gene expression associated with JAK2V617F mutation in HSPCs. Beeswarm plots show selected differentially expressed genes between (C) JAK2 wild-type (WT) and JAK2V617F-heterozygous mutant cells from patient IF0602 or (E) JAK2 WT and JAK2V617F-homozygous mutant cells from patient IF0111. Expression values for single cells from two normal donors (NORMAL) are also shown. Each dot represents the expression value for each single cell; red squares represent mean expression values for each group, and boxes represent median and quartiles. Fisher’s test and Wilcoxon test p values are shown on the top of each graph; expressing cell frequencies are shown on the bottom of each bar for each group. Table S4A (patient IF0602) and Table S4C (patient IF0111) show all significant, differentially expressed genes. (D) GSEA analysis of JAK2 WT and JAK2V617F-heterozygous mutant cells from patient IF0602 or (F) JAK2 WT and JAK2V617F-homozygous mutant cells from patient IF0111, as well as cells from normal donors (NORMAL). The heatmap represents –log10(FDR q-values) for each comparison, for which a FDR q-value cut-off < 0.25 was used; a white color with “ns” represents non-significance. The borders of each square of the heatmap are colored according to the group in which a particular pathway is enriched. Table S4B (patient IF0602) and Table S4D (patient IF0111) show results for all significant genesets tested. (G) Integration of index sorting with mutational information for patient OX4739. (H) Beeswarm plots of selected genes identified as biomarkers of JAK2 mutant cells independently of the patient analyzed. Expression values across HSPCs from patients IF0602, IF0111, OX4739 (JAK2 WT and JAK2V617F mutant cells shown separately), and two normal donors (NORMAL) are shown; expression frequencies are provided at the bottom of each graph for each group. (I) A Beeswarm plot of VWF expression values across HSPCs for the same patients and normal donors as in (H). Each dot represents the expression value for each single cell; red squares represent mean expression values for each group, and boxes represent the median and quartiles. Fisher’s test and Wilcoxon test p values are shown on the top of each graph; expressing cell frequencies are shown on the bottom of each bar for each group.
Figure 4
Figure 4
TARGET-Seq Reveals Distinct Transcriptional Signatures Associated with the Presence or Absence of Somatic Mutations in Single HSPCs (A) tSNE representation of 236 wild-type (WT) HSPCs from the three samples (from patients IF0602, SMD32316, and IF0111) in which WT cells are present, and cells from two normal donors (donors HD7650 and HD7643); 5,365 highly variable genes were used. Cells from normal donors are colored in gray, and cells from patients with MPN are colored in orange (patients SMD32316 and IF0602) or red (patient IF0111; patient treated with interferon). (B) Enrichment of IFN-α (left) or IFN-γ (right) signaling gene signatures as a projection of ssGSEA results at the same tSNE coordinates from the cells of the specific donors or patients shown in (A). Each shape represents a group of donors. (C) tSNE representation of 448 HSPCs from five patients and two normal controls; the top 2,000 genes as measured by the Gini index from the random forest analysis were used. Only genotypes present in at least five cells were analyzed. The gene expression matrix was batch- and donor-corrected, and genotypes were preserved. (D and E) Enrichment of EZH2-related pathways, TET2-related pathways (D), or the JAK/STAT pathway (E) in cells carrying mutations in these genes compared to (n = 106) cells from two normal donors. The heatmap represents –log10(FDR q-values) for each comparison, using a FDR q-value cut-off < 0.25. A complete list of all significant genesets tested can be found in Tables S4F and S4G, and a summary list of all genesets can be found in Table S4H.
Figure 5
Figure 5
High-Throughput TARGET-Seq Identifies Molecular Signatures of Genetic Subclones in HSPCs from JAK2-V617F Mutant Myelofibrosis (A) tSNE representation of 2,734 HSPCs from eight patients and two age-matched normal donors; the samples were processed with 3′-TARGET-seq, and 3,286 highly variable genes were used for the analysis. Cells from age-matched normal donors are colored in light gray (NORMAL). Wild-type (WT) cells from patients with MF are colored in dark gray (“WT-P”). Cells carrying mutations exclusively in JAK2 are colored in blue (“J”); those carrying mutations in JAK2 and epigenetic modifiers (TET2 and ASXL1) are colored in purple (“JE”); those carrying mutations in JAK2 and spliceosome components (SF3B1, SRSF2, and U2AF1) are colored in light green (“JS”); and those carrying mutations in JAK2, spliceosome components, and epigenetic modifiers are colored in dark green (“JSE”). The gene expression matrix was batch- and donor-corrected, and genotypes were preserved. (B) Boxplots of representative differentially expressed genes from JAK2 only (B4GALT1), JAK2+epigenetic (PITX1), JAK2+spliceosome (ZFP36), or JAK2+spliceosome+epigenetic (PHB and ZFP36) genetic subclones. Each dot represents the expression value for each single cell; boxes represent median and quartiles, and the central line represents the median for each group. Expression frequencies are shown on the bottom of each bar for each group. (C) Boxplot of overall Pearson’s correlation of cells from normal donors and cells from MF-patient samples; the cells are grouped per donor type (normal donor or patient sample; left panel) or by the genotype groups presented in (A) (right panel). A Kolmogorov-Smirnov test provided the significance level for each comparison (∗∗∗; p value < 0.001). (D) tSNE representation of 1,066 WT cells from six patients and two normal donors; 3,436 highly variable genes were used. The gene expression matrix was batch-corrected, and the donor effect was preserved. (E) tSNE projection (from the same cells as in [D]) representing relative gene expression levels from selected differentially expressed inflammation-associated genes in WT cells from patients and normal donors. (F) Enrichment of selected pathways in the same WT cells from the same samples as in (D) and (E) from normal donors and patients. A complete list of all significant genesets tested can be found in Table S5A. (G) tSNE projection representing relative gene expression levels from selected differentially expressed oncogenes (FOS) and tumor suppressors (ANXA1) between the same WT cells from patients and normal donors as in (D). (H) tSNE representation of 769 WT and JAK2-only mutant HSPCs from four patients with MF (patients IF0138, IF0155, IF0157, and IF0602); we used the top 2,000 genes as identified by the Gini index from random forest analysis. (I) Enrichment of selected HALLMARK and STAT5A pathways from the same cells as in (H), as well as cells from normal donors (NORMAL). A complete list of all significant genesets tested can be found in Tables S5B and S5C, and specific comparisons for subclones within patients can be found in Table S5D. (J and K) Analysis of disrupted gene expression associated with JAK2V617F mutation in HSPCs. Boxplots show selected differentially expressed genes specifically upregulated in JAK2 mutant cells independently of zygosity (J) or exclusively in JAK2-homozygous cells (K). Each dot represents the expression value for each single cell; boxes represent median and quartiles, and the central line represents the median for each group. Expressing-cell frequencies are shown on the bottom of each bar for each group. A complete list of all significant differentially expressed genes and associated p values can be found in Table S5E. The heatmaps are colored according to –log10(FDR q-values) for each comparison, for which an FDR q-value cut-off < 0.25 was used. The borders of each square of the heatmap are colored according to the group in which a particular pathway is enriched; a white color with “ns” represents non-significance.
Figure 6
Figure 6
TARGET-Seq Resolves Genetic and Transcriptional Heterogeneity of HSPCs within Individual Myelofibrosis Patients (A and B) Distinct transcriptional signatures of genetic subclones identified by TARGET-seq in patient IF0137. (A) tSNE representation of 555 cells; 633 differentially expressed genes identified with ANOVA were used and (B) boxplots of selected differentially expressed genes between each genetic subclone from the same cells as in (A). Genetic subclones carrying JAK2, U2AF1, and ASXL1 (p897/p910) mutations from patient IF0137 are labeled JAK2-HET+U2AF1-HET+ASXL1-HET and were analyzed together as indicated. Each genetic subclone is colored and labeled according to the legend provided in (A). (C and D) Distinct transcriptional signatures of genetic subclones from patient IF0138. (C) tSNE representation of 243 cells; 418 differentially expressed genes identified with ANOVA were used. (D) Boxplots of selected differentially expressed genes between distinct genetic subclones. Each genetic subclone is colored according to the legend provided in (C). (E and F) Distinct transcriptional signatures of genetic subclones from patient IF0101. (E) tSNE representation of 320 cells; 500 differentially expressed genes identified with ANOVA were used. (F) Boxplots of selected differentially expressed genes between distinct genetic subclones. Each genetic subclone is colored according to the legend provided in (E). Each dot represents the expression value for each single cell; boxes represent median and quartiles, and the central line represents the median for each group. Expressing cell frequencies are shown on the bottom of each bar for each group. The list of differentially expressed genes identified in each patient and associated p values for each comparison can be found in Table S6. Only genetic subclones representing at least 5% of the total cells for each patient are included in the analysis.

Comment in

Similar articles

Cited by

References

    1. Cheow L.F., Courtois E.T., Tan Y., Viswanathan R., Xing Q., Tan R.Z., Tan D.S., Robson P., Loh Y.H., Quake S.R., Burkholder W.F. Single-cell multimodal profiling reveals cellular epigenetic heterogeneity. Nat. Methods. 2016;13:833–836. - PubMed
    1. Clevers H. The cancer stem cell: premises, promises and challenges. Nat. Med. 2011;17:313–319. - PubMed
    1. Cooper T.A., Wan L., Dreyfuss G. RNA and disease. Cell. 2009;136:777–793. - PMC - PubMed
    1. David C.J., Manley J.L. Alternative pre-mRNA splicing regulation in cancer: pathways and programs unhinged. Genes Dev. 2010;24:2343–2364. - PMC - PubMed
    1. Dey S.S., Kester L., Spanjaard B., Bienko M., van Oudenaarden A. Integrated genome and transcriptome sequencing of the same cell. Nat. Biotechnol. 2015;33:285–289. - PMC - PubMed

Publication types

Substances