BNIP3L/NIX and FUNDC1-mediated mitophagy is required for mitochondrial network remodeling during cardiac progenitor cell differentiation
- PMID: 30741592
- PMCID: PMC6613840
- DOI: 10.1080/15548627.2019.1580095
BNIP3L/NIX and FUNDC1-mediated mitophagy is required for mitochondrial network remodeling during cardiac progenitor cell differentiation
Abstract
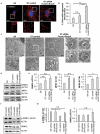
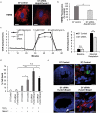
Cell-based therapies represent a very promising strategy to repair and regenerate the injured heart to prevent progression to heart failure. To date, these therapies have had limited success due to a lack of survival and retention of the infused cells. Therefore, it is important to increase our understanding of the biology of these cells and utilize this information to enhance their survival and function in the injured heart. Mitochondria are critical for progenitor cell function and survival. Here, we demonstrate the importance of mitochondrial autophagy, or mitophagy, in the differentiation process in adult cardiac progenitor cells (CPCs). We found that mitophagy was rapidly induced upon initiation of differentiation in CPCs. We also found that mitophagy was mediated by mitophagy receptors, rather than the PINK1-PRKN/PARKIN pathway. Mitophagy mediated by BNIP3L/NIX and FUNDC1 was not involved in regulating progenitor cell fate determination, mitochondrial biogenesis, or reprogramming. Instead, mitophagy facilitated the CPCs to undergo proper mitochondrial network reorganization during differentiation. Abrogating BNIP3L- and FUNDC1-mediated mitophagy during differentiation led to sustained mitochondrial fission and formation of donut-shaped impaired mitochondria. It also resulted in increased susceptibility to cell death and failure to survive the infarcted heart. Finally, aging is associated with accumulation of mitochondrial DNA (mtDNA) damage in cells and we found that acquiring mtDNA mutations selectively disrupted the differentiation-activated mitophagy program in CPCs. These findings demonstrate the importance of BNIP3L- and FUNDC1-mediated mitophagy as a critical regulator of mitochondrial network formation during differentiation, as well as the consequences of accumulating mtDNA mutations. Abbreviations: Baf: bafilomycin A1; BCL2L13: BCL2 like 13; BNIP3: BCL2 interacting protein 3; BNIP3L: BCL2 interacting protein 3 like; CPCs: cardiac progenitor cells; DM: differentiation media; DNM1L: dynamin 1 like; EPCs: endothelial progenitor cells; FCCP: carbonyl cyanide-4-(trifluoromethoxy)phenylhydrazone; FUNDC1: FUN14 domain containing 1; HSCs: hematopoietic stem cells; MAP1LC3B/LC3: microtubule-associated protein 1 light chain 3 beta; MFN1/2: mitofusin 1/2; MSCs: mesenchymal stem cells; mtDNA: mitochondrial DNA; OXPHOS: oxidative phosphorylation; PPARGC1A: PPARG coactivator 1 alpha; PHB2: prohibitin 2; POLG: DNA polymerase gamma, catalytic subunit; SQSTM1: sequestosome 1; TEM: transmission electron microscopy; TMRM: tetramethylrhodamine methyl ester.
Keywords: Autophagy; differentiation; heart failure; mitochondria; mitophagy; stem cells.
Figures


Similar articles
-
BNIP3L-mediated mitophagy is required for mitochondrial remodeling during the differentiation of optic nerve oligodendrocytes.Autophagy. 2021 Oct;17(10):3140-3159. doi: 10.1080/15548627.2020.1871204. Epub 2021 Jan 19. Autophagy. 2021. PMID: 33404293 Free PMC article.
-
Autophagy regulates functional differentiation of mammary epithelial cells.Autophagy. 2021 Feb;17(2):420-438. doi: 10.1080/15548627.2020.1720427. Epub 2020 Feb 5. Autophagy. 2021. PMID: 31983267 Free PMC article.
-
Dimerization of mitophagy receptor BNIP3L/NIX is essential for recruitment of autophagic machinery.Autophagy. 2021 May;17(5):1232-1243. doi: 10.1080/15548627.2020.1755120. Epub 2020 Apr 24. Autophagy. 2021. PMID: 32286918 Free PMC article.
-
Organelle-specific autophagy in inflammatory diseases: a potential therapeutic target underlying the quality control of multiple organelles.Autophagy. 2021 Feb;17(2):385-401. doi: 10.1080/15548627.2020.1725377. Epub 2020 Feb 12. Autophagy. 2021. PMID: 32048886 Free PMC article. Review.
-
A brief overview of BNIP3L/NIX receptor-mediated mitophagy.FEBS Open Bio. 2021 Dec;11(12):3230-3236. doi: 10.1002/2211-5463.13307. Epub 2021 Oct 11. FEBS Open Bio. 2021. PMID: 34597467 Free PMC article. Review.
Cited by
-
Ischemic Preconditioning and Postconditioning Protect the Heart by Preserving the Mitochondrial Network.Biomed Res Int. 2022 Sep 27;2022:6889278. doi: 10.1155/2022/6889278. eCollection 2022. Biomed Res Int. 2022. PMID: 36203484 Free PMC article.
-
IGF-1 Signaling Regulates Mitochondrial Remodeling during Myogenic Differentiation.Nutrients. 2022 Mar 16;14(6):1249. doi: 10.3390/nu14061249. Nutrients. 2022. PMID: 35334906 Free PMC article.
-
The mitophagy receptor BNIP3 is critical for the regulation of metabolic homeostasis and mitochondrial function in the nucleus pulposus cells of the intervertebral disc.Autophagy. 2023 Jun;19(6):1821-1843. doi: 10.1080/15548627.2022.2162245. Epub 2023 Jan 10. Autophagy. 2023. PMID: 36628478 Free PMC article.
-
Enriched Environment-Induced Neuroprotection against Cerebral Ischemia-Reperfusion Injury Might Be Mediated via Enhancing Autophagy Flux and Mitophagy Flux.Mediators Inflamm. 2022 Jun 27;2022:2396487. doi: 10.1155/2022/2396487. eCollection 2022. Mediators Inflamm. 2022. PMID: 35795405 Free PMC article.
-
Mitophagy in Cancer: A Tale of Adaptation.Cells. 2019 May 22;8(5):493. doi: 10.3390/cells8050493. Cells. 2019. PMID: 31121959 Free PMC article. Review.
References
-
- Writing Group M, Mozaffarian D, Benjamin EJ, et al. Heart disease and stroke statistics-2016 update: a report from the American heart association. Circulation. 2016. January 26;133(4):e38–e60. - PubMed
Publication types
MeSH terms
Substances
Grants and funding
LinkOut - more resources
Full Text Sources
Other Literature Sources
Research Materials
Miscellaneous
