. 2019 Jan 25:10:44.
doi: 10.3389/fimmu.2019.00044. eCollection 2019.

The TYK2-P1104A Autoimmune Protective Variant Limits Coordinate Signals Required to Generate Specialized T Cell Subsets

Affiliations

The TYK2-P1104A Autoimmune Protective Variant Limits Coordinate Signals Required to Generate Specialized T Cell Subsets

Jacquelyn A Gorman et al. Front Immunol. .

Abstract

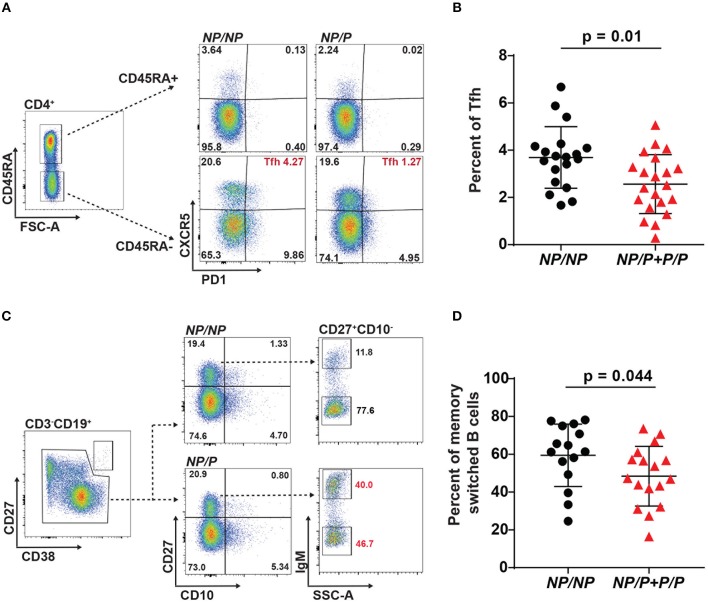
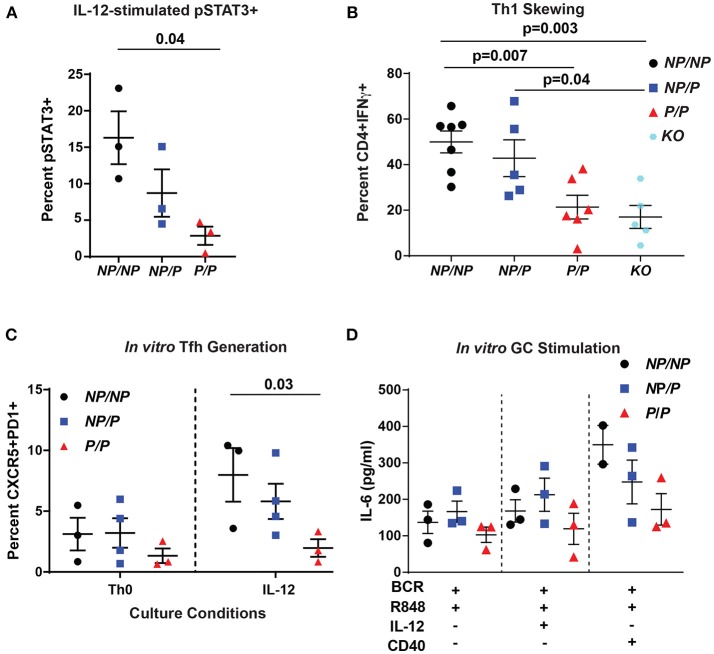
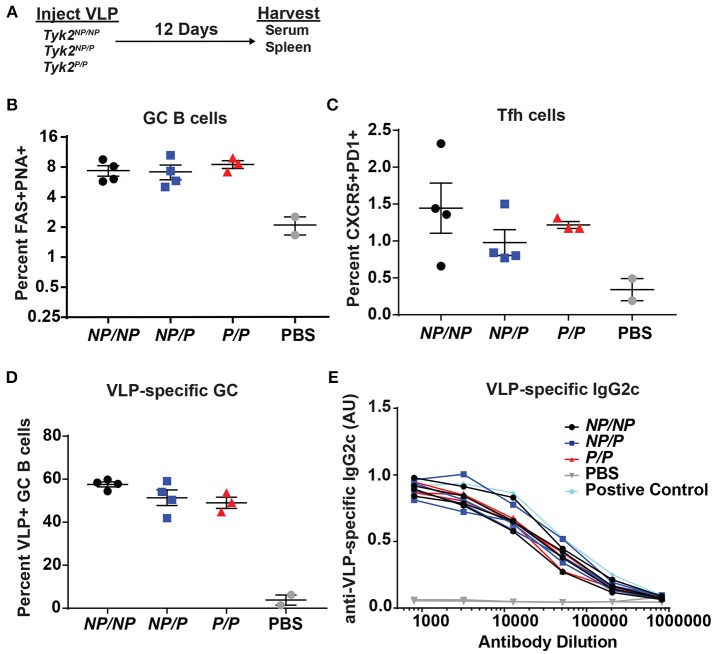
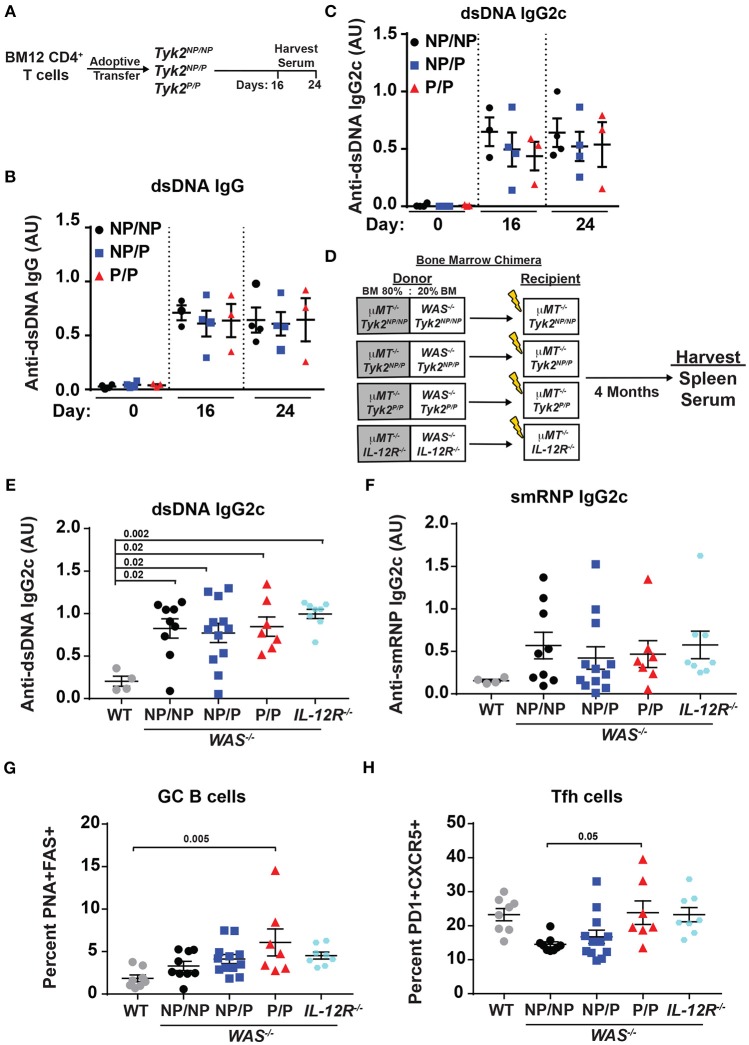
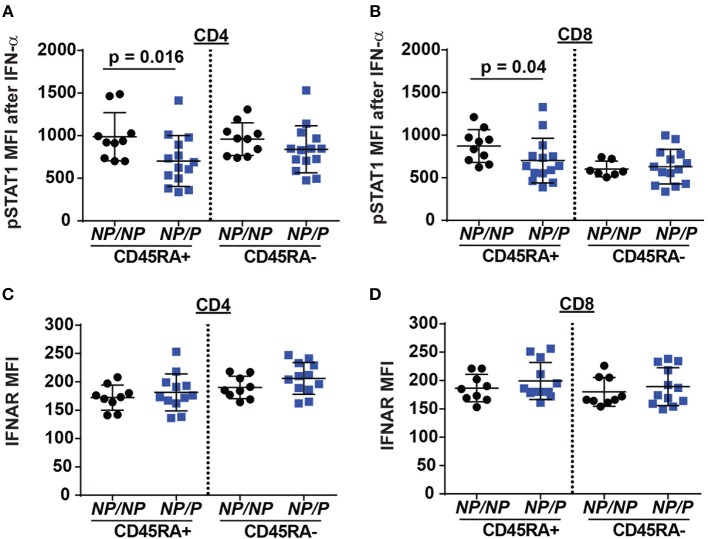
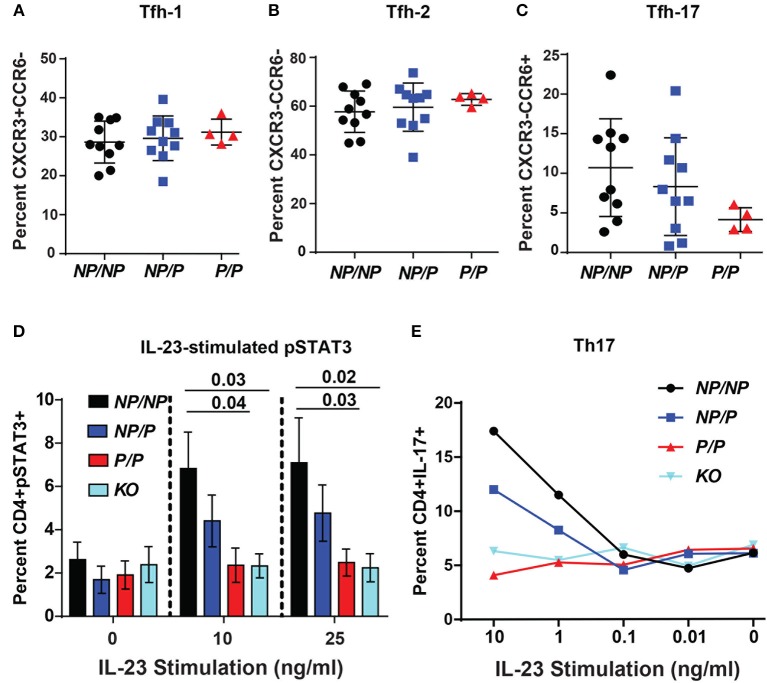
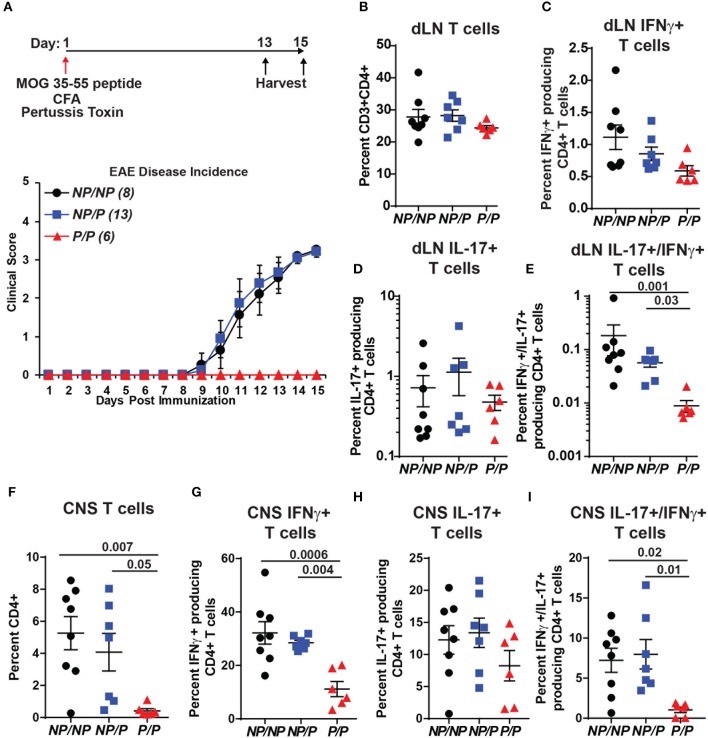
TYK2 is a JAK family member that functions downstream of multiple cytokine receptors. Genome wide association studies have linked a SNP (rs34536443) within TYK2 encoding a Proline to Alanine substitution at amino acid 1104, to protection from multiple autoimmune diseases including systemic lupus erythematosus (SLE) and multiple sclerosis (MS). The protective role of this SNP in autoimmune pathogenesis, however, remains incompletely understood. Here we found that T follicular helper (Tfh) cells, switched memory B cells, and IFNAR signaling were decreased in healthy individuals that expressed the protective variant TYK2A1104 (TYK2P ). To study this variant in vivo, we developed a knock-in murine model of this allele. Murine Tyk2P expressing T cells homozygous for the protective allele, but not cells heterozygous for this change, manifest decreased IL-12 receptor signaling, important for Tfh lineage commitment. Further, homozygous Tyk2P T cells exhibited diminished in vitro Th1 skewing. Surprisingly, despite these signaling changes, in vivo formation of Tfh and GC B cells was unaffected in two models of T cell dependent immune responses and in two alternative SLE models. TYK2 is also activated downstream of IL-23 receptor engagement. Here, we found that Tyk2P expressing T cells had reduced IL-23 dependent signaling as well as a diminished ability to skew toward Th17 in vitro. Consistent with these findings, homozygous, but not heterozygous, Tyk2P mice were fully protected in a murine model of MS. Homozygous Tyk2P mice had fewer infiltrating CD4+ T cells within the CNS. Most strikingly, homozygous mice had a decreased proportion of IL-17+/IFNγ+, double positive, pathogenic CD4+ T cells in both the draining lymph nodes (LN) and CNS. Thus, in an autoimmune model, such as EAE, impacted by both altered Th1 and Th17 signaling, the Tyk2P allele can effectively shield animals from disease. Taken together, our findings suggest that TYK2P diminishes IL-12, IL-23, and IFN I signaling and that its protective effect is most likely manifest in the setting of autoimmune triggers that concurrently dysregulate at least two of these important signaling cascades.

Keywords: IFNAR; IL-12; IL-23; TYK2; Tfh; autoimmunity; germinal center; lupus.


Figures

Figure 1
Figure 1
Healthy subjects expressing the TyK2 protective variant exhibit decreased proportion of circulating Tfh and switched memory B cells. (A) Gating strategy for T follicular helper (Tfh) cells, defined as CD4+CD45RACXCR5+PD1+ T cells. Shown are representative dot plots of the Tfh cell frequency in subjects with TYK2NP/NP (NP/NP), TYK2NP/P (NP/P), or TYK2P/P (P/P) (non-protective (NP) vs. protective (P) alleles of rs34536443; encoding for Alanine-1104 vs. Proline-1104). (B) Quantification of Tfh cell frequency. (C) Gating strategy for switched memory B cells, defined as plasmablast (PB) negative CD3CD19+CD27+CD10IgM B cells. Shown are representative dot plots of the switched memory B cell frequency in subjects. (D) Quantification of switched memory B cell frequency (Each symbol represents an individual donor) (B,D); small horizontal lines indicate the mean (± s.d.). Data from a combined total of n = 19 Tyk2NP/NP donors, n = 19 TYK2NP/P donors, and n = 2 TYK2P/P donors (A,B); n = 15 TYK2NP/NP donors, n = 13 TYK2NP/P donors, and n = 4 TYK2P/P donors (C,D). Statistical analysis indicated from a Mann-Whitney U (B,D).
Figure 2
Figure 2
Murine Tyk2P lymphocytes exhibit decreased IL-12 signaling and reduced in vitro generation Tfh cells and IL-6 production in response to GC programming. (A–C) Splenic CD4+ T cells were isolated from Tyk2NP/NP (NP/NP), Tyk2NP/P (NP/P), Tyk2P/P (P/P), or Tyk2−/− (KO) mice. (A) CD4+ T cells were stimulated with 2 ng/mL of IL-12 for 20 min and assessed for phosphorylation of STAT3 (pSTAT3) using flow cytometry. (B) Frequency of IFN-γ+ CD4+ T cells following in vitro Th1 skewing culture conditions with IL-12, IL-2, and anti-IL-4 for five days and analyzed by flow cytometry. (C) Frequency of Tfh-like T cells (CD4+ CXCR5+PD1+) following culture with the indicated cytokines for six days. (D) Splenic B cells were isolated from Tyk2NP/NP (NP/NP), Tyk2NP/P (NP/P), or Tyk2P/P (P/P) mice. IL-6 production from B cells stimulated with the indicated cytokines for 48 h. Small horizontal lines indicate the mean (± s.e.m.). Statistical analysis were performed using Friedman Test with Dunn's multiple comparison (A), one-way ANOVA with Tukey's multiple comparisons test (B,D), and two-way ANOVA with Tukey's multiple comparisons test (C). Data are derived from three (A,C,D) or seven independent experiments (B). Each symbol represents an individual biological replicate (individual mouse); Tyk2NP/NP n = 3, Tyk2NP/P n = 3, or Tyk2P/P n = 3 (A,D); Tyk2NP/NP n = 7, Tyk2NP/P n = 5,Tyk2P/P n = 6 or Tyk2KO n = 5 (B); Tyk2NP/NP n = 3, Tyk2NP/P n = 4, or Tyk2P/P n = 3 (C).
Figure 3
Figure 3
Tfh and GC B cell formation in vivo in response to immunization with virus-like particles is not impacted by Tyk2P expression. (A) Experimental schematic for VLP immunization. Tyk2NP/NP (NP/NP), Tyk2NP/P (NP/P), or Tyk2P/P (P/P) mice were immunized i.p. with 2 μg of TLR7-loaded virus-like particles (VLP) or with PBS as control. Splenocytes were analyzed for frequency of: (B) germinal center (GC) B cells (B220+FAS+PNA+); (C) Tfh cells (CD4+CXCR5+PD1+); and (D) VLP+ GC B cells at day 12 post-immunization. (E) Sera was collected at day 12 post-immunization and assessed by ELISA for VLP-specific IgG2c antibodies. Small horizontal lines indicate the mean (± s.e.m.). ELISA results are displayed as absorbance at 450 nm normalized to results using a blank well and presented in arbitrary units (AU) (E). Representative data are shown from one of two independent experiments (B–E). Statistical analysis was performed using one-way ANOVA with Tukey's multiple comparisons test (B–D). Each symbol represents an individual biological replicate; Tyk2NP/NP n = 4, Tyk2NP/P n = 4, Tyk2P/P n = 3, PBS n = 2, or Positive Control n = 1 (B–E).
Figure 4
Figure 4
Tyk2P and IL12R−/− mice are not protected in murine models of lupus. (A) Experimental schematic for BM12 CD4+ T cell adoptive transfer model. 5.0 × 10⁶ BM12 CD4+ T cells were adoptively transferred into Tyk2NP/NP, Tyk2NP/P, or Tyk2P/P recipient mice and autoantibodies and splenic cell populations (not shown) were assessed at indicated times. Serum ELISA analysis for: (B) anti-dsDNA IgG and (C) anti-dsDNA IgG2c autoantibodies. (D) Schematic for establishment of B cell-specific bone marrow (BM) chimeras using an 80%:20% mixture of bone marrow from μMT−/− mice and WT or Wiskott-Aldrich knock-out (WAS−/−) donor cells with the indicated Tyk2 or IL-12R alleles (WAS−/−Tyk2NP/NP, WAS−/−Tyk2NP/P, WAS−/−Tyk2P/P, WAS−/−IL-12R−/−), respectively. Yellow lightning bolt represents irradiation of recipient mice. See methods for additional details of experimental design. (E,F) ELISA analysis of serum at 16 week post-transplantation for: (E) anti-dsDNA IgG2c and (F) anti-smRNP IgG2c autoantibodies in indicated recipient mice. (G,H) Splenocytes were isolated at 16 week and analyzed by flow cytometry for frequency of: (G) GC and (H) Tfh cells as described in Figure 2. Small horizontal lines indicate the mean (± s.e.m.). ELISA results are displayed as absorbance at 450 nm normalized to results of a blank well and presented in arbitrary units (AU). (B,C,E,F) Statistical analysis was performed using one-way ANOVA with Tukey's multiple comparisons test. Data are representative of two independent experiments (B,C) or data combined from two independent experiments (E–H). Each symbol represents an individual biological replicate;Tyk2NP/NP n = 3, Tyk2NP/P n = 4,Tyk2P/P n = 3 or PBS n = 2 (A-C); WT n = 4,Tyk2NP/NP n = 9, Tyk2NP/P n = 12,Tyk2P/P n = 7 or IL-12R−/− n = 8 (E,F); WT n = 8,Tyk2NP/NP n = 9, Tyk2NP/P n = 12,Tyk2P/P n = 7 or IL-12R−/− n = 8 (G,H).
Figure 5
Figure 5
Decreased IFN-α/pSTAT1 signaling in naive T cells from healthy subjects expressing the TYK2 protective variant. PBMC from healthy subjects with TYK2NP/NP (NP/NP) or heterozygote for the protective allele TYK2NP/P (NP/P), were thawed and stimulated with 2,000 IU/ml recombinant IFN-α for 12 min and assessed using flow-cytometry for phosphorylation of STAT1 (pSTAT1) or IFN I receptor (IFNAR) surface expression. Quantification of pSTAT1 MFI following IFN-α stimulation in: (A) naive (RA+) and memory (RA-) CD4+ and (B) CD8+ T cells. Quantification of IFNAR mean fluorescence intensity (MFI) in: (C) naive (RA+) and memory (RA-) CD4+ and (D) CD8+ T cells. Each symbol represents an individual donor (A–D); small horizontal lines indicate the mean (± s.d.). Data from a combined total of n = 10 TYK2NP/NP donors or n = 14 TYK2NP/P donors (A–D). Statistical analysis performed using Mann-Whitney U testing (A–D).
Figure 6
Figure 6
Healthy subjects expressing the TYK2 protective variant exhibit decreased circulating Tfh-17 cells and Tyk2P mice exhibit reduced IL-23 signaling and Th17 skewing. (A–C), Quantification of Tfh subsets in healthy subjects with TYK2NP/NP (NP/NP), TYK2NP/P (NP/P), or TYK2P/P (P/P) alleles, respectively. Results of flow cytometry studies assessing the frequency of: (A), CXCR3+CCR6 Tfh-1; (B) CXCR3CCR6 Tfh-2; and (C) CXCR3CCR6+ Tfh-17 T cells within the CD4+CXCR5+ cell population. Each symbol represents an individual donor. (D,E) Splenic CD4+ T cells were isolated from Tyk2NP/NP (NP/NP), Tyk2NP/P (NP/P), Tyk2P/P (P/P) or Tyk2−/− (KO) mice. (D) CD4+ T cells were stimulated with using the indicated amounts of IL-23 for 15 min and assessed using flow cytometry for phosphorylation of STAT3 (pSTAT3). (E) CD4+ T cells were cultured in Th-17 skewing conditions with indicated amounts of IL-23 and assessed for the frequency of IL-17+ CD4 (Th-17) T cells. (A–C) small horizontal lines indicate the mean (± s.d.) and (D) mean (± s.e.m.). Data from a combined total of n = 10 TYK2NP/NP donors, n = 10 TYK2NP/P donors, and n = 4 TYK2P/P donors (A–C). Data are representative of three independent experiments (D) and one experiment (E). Statistical analysis were performed using Kruskal-Wallis (A–C) and two-way ANOVA with Tukey's multiple comparisons test (D).
Figure 7
Figure 7
Tyk2P variant mice are protected in a murine model of multiple sclerosis. (A) (Upper) Schematic of experimental design for induction of EAE by immunization with MOG peptide. Tyk2NP/NP(n = 8), Tyk2NP/P(n = 13), and Tyk2P/P(n = 6) mice were immunized (red arrow) and evaluated clinically for 15 days. (Lower) EAE clinical score was determined as per methods (1 = Tail limp, 2 = 1 hind leg paralyzed, 3 = 2 hind legs paralyzed, 4 = front leg paralyzed). (B–G) Tissues were collected at Day 13 or Day 15 post-immunization and T lymphocyte populations were evaluated using flow cytometry. (B–D) Frequency of T cells within the draining lymph nodes (dLN) showing: (B) total T cells; (C) IFN-γ+ T cells (D) IL-17+ T cells, and (E) IL-17+/IFN-γ+ double positive T cells (F–I). Frequency of T cells within the central nervous system (CNS) showing: (F) total T cells; (G) IFN-γ+ T cells; (H), IL-17+ T cells; and (I) IL-17+/IFN-γ+ T cells. (B–I); Each symbol represents an individual animal; small horizontal lines indicate the mean (± s.e.m.). Flow cytometry data shown are from 2 independent experiments including: Tyk2NP/NP (n = 7) Tyk2NP/P (n = 7) and Tyk2P/P (n = 6) animals. (C–I) Data shown are combined from cells collected on day 13 or 15. Statistical analysis was performed using a two-way ANOVA with Tukey's multiple comparisons test.

Similar articles

Cited by

References

    1. Tsokos GC, Lo MS, Reis PC, Sullivan KE. New insights into the immunopathogenesis of systemic lupus erythematosus. Nat Rev Rheumatol. (2016) 12:716–30. 10.1038/nrrheum.2016.186 - DOI - PubMed
    1. Kaul A, Gordon C, Crow MK, Touma Z, Urowitz MB, van Vollenhoven R, et al. . Systemic lupus erythematosus. Nat Rev Dis Primers (2016) 2:16039. 10.1038/nrdp.2016.39 - DOI - PubMed
    1. Qiu H, Wu H, Chan V, Lau C-S, Lu Q. Transcriptional and epigenetic regulation of follicular T-helper cells and their role in autoimmunity. Autoimmunity (2017) 50:71–81. 10.1080/08916934.2017.1284821 - DOI - PubMed
    1. Choi JY, Ho JHE, Pasoto SG, Bunin V, Kim ST, Carrasco S, et al. . Circulating follicular helper–like T cells in systemic lupus erythematosus: association with disease activity. Arthritis Rheumatol. (2015) 67:988–99. 10.1002/art.39020 - DOI - PMC - PubMed
    1. Victora GD, Nussenzweig MC. Germinal Centers. Ann Rev Immunol. (2012) 30:429–57. 10.1146/annurev-immunol-020711-075032 - DOI - PubMed

Publication types

MeSH terms