Length-independent telomere damage drives post-mitotic cardiomyocyte senescence
- PMID: 30737259
- PMCID: PMC6396144
- DOI: 10.15252/embj.2018100492
Length-independent telomere damage drives post-mitotic cardiomyocyte senescence
Abstract
Ageing is the biggest risk factor for cardiovascular disease. Cellular senescence, a process driven in part by telomere shortening, has been implicated in age-related tissue dysfunction. Here, we address the question of how senescence is induced in rarely dividing/post-mitotic cardiomyocytes and investigate whether clearance of senescent cells attenuates age-related cardiac dysfunction. During ageing, human and murine cardiomyocytes acquire a senescent-like phenotype characterised by persistent DNA damage at telomere regions that can be driven by mitochondrial dysfunction and crucially can occur independently of cell division and telomere length. Length-independent telomere damage in cardiomyocytes activates the classical senescence-inducing pathways, p21CIP and p16INK4a, and results in a non-canonical senescence-associated secretory phenotype, which is pro-fibrotic and pro-hypertrophic. Pharmacological or genetic clearance of senescent cells in mice alleviates detrimental features of cardiac ageing, including myocardial hypertrophy and fibrosis. Our data describe a mechanism by which senescence can occur and contribute to age-related myocardial dysfunction and in the wider setting to ageing in post-mitotic tissues.
Keywords: ageing; cardiomyocytes; senescence; senolytics; telomeres.
© 2019 The Authors. Published under the terms of the CC BY 4.0 license.
Conflict of interest statement
Patents on INK‐ATTAC mice are held by Mayo Clinic and licensed to Unity Biotechnology. J.L.K. and T.T. may gain financially from these patents and licences. This research has been reviewed by the Mayo Clinic Conflict of Interest Review Board and was conducted in compliance with Mayo Clinic Conflict of Interest policies. The remaining authors declare no competing financial interests.
Figures

- A
Representative images of γH2AX immuno‐FISH in troponin‐C‐positive/α‐actinin‐positive (top left and bottom left panels, respectively) mouse CMs (white—troponin‐C/α‐actinin; red—telo‐FISH; green—γH2AX). Images are Z‐projections of 0.1 μm stacks taken with a 100× oil objective. Scale bar: 20 μm. Right panels represent a single z‐planes where co‐localisation between a γH2AX foci and telomere was observed. Scale bars 1 μm. (Below) 3D reconstruction of Immuno‐FISH using STED microscopy for γH2A.X and telomeres in a CM from 30‐month‐old mice. Scale bars as indicated and scale the same for both individual TAF examples using STED.
- B, C
Mean number of TAF (B) and % of TAF‐positive (C) α‐actinin‐positive CMs from C57BL/6 mice. Data are mean ± SEM of n = 4–7 mice per age group. 100 α‐actinin‐positive CMs were quantified per mouse.
- D, E
Mean number of total γH2A.X foci (D) and % of γH2A.X foci‐positive nuclei (E) in α‐actinin‐positive CMs from C57BL/6 mice. Data are mean ± SEM of n = 4–7 mice per age group. 100 α‐actinin‐positive CMs were quantified per mouse.
- F
Fold enrichment of γH2AX at telomere repeats by real‐time PCR. Graph represents fold enrichment of γH2AX at telomeric repeats between IgG control, 3‐ and 30‐month‐old whole mouse hearts. Data are mean ± SEM of n = 3 mice per age group.
- G
Quantitative PCR‐ELISA TRAP assay comparing telomerase activity of 3‐ and 30‐month‐old C57BL/6 mice whole heart lysates. Data are mean ± SEM of n = 4 mice per age group.
- H
Histograms displaying distributions of telomere intensity in CMs analysed by 3D Q‐FISH in young (4 months) and old (30 months) wild‐type mice. Data are from n = 3 mice. > 100 CMs were analysed per mouse.
- I
% of telomere FISH signal loss in 30‐month‐old wild‐type mice and late generation Terc−/− mice (6 months old) in comparison with 4‐month‐old wild‐type mice. Data are from n = 3 mice. > 100 CMs were analysed per mouse.
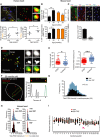
Representative images of γH2A.X immuno‐FISH in PCM1‐positive human cardiomyocytes (blue—DAPI; yellow—PCM1; red—telo‐FISH; green—γH2A.X). Images are z‐projections of 4.5 μm stacks taken with 100× objective. Right panels show co‐localisation between telomeres and γH2AX, with taken from single z‐planes where co‐localisation was found. Graphs showing mean number of TAF (left) and mean percentage of TAF‐positive nuclei (right) in PCM1‐positive human cardiomyocytes from 46‐year‐old to 65‐year‐old and 74‐year‐old to 82‐year‐old human heart tissue. Data are represented as the mean for individual subjects, with the horizontal line representing group mean. *P < 0.05 statistical significance using two‐tailed t‐test. Scale bars as indicated.
Quantification of 53BP1 Immuno‐FISH in 4‐month‐old and 24‐month‐old mice. Graphs representing mean number of TAF and % of cardiomyocytes positive for TAF are in black and graphs representing mean number of 53BP1 and % of cardiomyocytes positive for 53BP1 are in orange; n = 3 mice per age group; > 100 cardiomyocytes were quantified. Asterisk denotes a statistical significance at P < 0.01 using two‐tailed t‐test.
Above: Representative images of PCM1 and α‐actinin, PCM1 and WGA and γH2A.X, PCM1 immuno‐FISH in 30‐month‐old mouse cardiac tissue. White arrows identify PCM1‐expressing CM nuclei. Below: Graph representing mean ± SEM number of TAF in PCM1‐positive versus PCM1‐negative cardiac cells; n = 3 mice; > 100 cardiomyocytes were quantified. Asterisk denotes a statistical significance at P < 0.01 using two‐tailed t‐test. Scale bars represent 20 μm.
Representative images of conventional confocal (green) versus STED microscopy (red) for detection of telomeres by Q‐FISH. Blue arrows identify telomeres shown in higher magnification in right 2‐panels. Note that STED microscopy is capable of discerning telomere clusters which would otherwise be detected by confocal microscopy as a single signal. (left) Main image scale bar represents 1 μm. (Right) Higher magnification images scale bars represent 500 μm.
Comparison between average number of telomere FISH signals detectable per cell (left graph) and mean telomere volume (right graph) in mouse cardiomyocytes, detected by either standard confocal or STED microscopy. Data are represented as the mean ± SEM for each measurement, with the horizontal line representing the group mean.
Representative image of immuno‐FISH using STED microscopy for γH2A.X and telomeres in cardiomyocytes from a 30‐month‐old mouse. Graph on the right side shows two telomere FISH signals of similar intensities (one showing co‐localisation with γH2A.X and the other not). Scale bar represents 1 μm.
Histograms representing Q‐FISH analysis by 3D STED microscopy comparing individual telomere length either co‐localising (TAF) or not co‐localising (non‐TAF) with γH2AX foci in mouse cardiomyocytes from n = 3 mice (aged 30 months of age). 300 cardiomyocytes (detected by troponin‐C and WGA) were analysed per mouse. Mann–Whitney test reveals no statistical significance between TAF and non‐TAF P = 0.13.
Histograms displaying telomere intensity for telomeres co‐localising (bottom) or not co‐localising (top) with γH2A.X DDR foci for PCM1‐positive cardiomyocytes obtained from 46‐year‐old to 65‐year‐old (left) and 74‐year‐old to 82‐year‐old subjects. Dotted lines represent median intensity. Mann–Whitney test show no significant difference in telomere intensity between TAF and non‐TAF in either 46‐year‐old to 65‐year‐old or 74‐year‐old to 82‐year‐old subjects (P > 0.05). More than 100 cardiomyocytes were quantified per subject.
Graph showing values for telomere FISH intensities either co‐localising (TAF) or not co‐localising (non‐TAF) with γH2AX foci in 22 individual cardiomyocytes chosen randomly. Purple arrow indicates one telomere FISH signal, which is lower in intensity than the median. Green horizontal lines denote median fluorescence intensity.
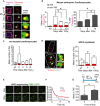
Representative images of mouse embryonic cardiomyocytes at days 0, 3, 5 and 10 days following 10 Gy X‐irradiation. Left panels represent troponin‐C‐positive embryonic cardiomyocytes (troponin‐C—magenta; DAPI—light blue). Middle panels display γH2AX foci (green) and telomeres (red) in Z‐projections of 0.1 μm slices, with white arrows indicating co‐localisation. Co‐localising foci are amplified in the right‐hand panels (amplified images represent a single z‐planes where co‐localisation was observed). Scale bars represent 10 μm. Scale bars in single‐plane images 500 nm.
(Left) Mean number of both TAF and non‐TAF in troponin I‐positive mouse embryonic cardiomyocytes at days 0, 3, 5 and 10 following 10 Gy X‐irradiation. Data are mean ± SEM of n = 3 independent experiments; 30–50 troponin‐positive cardiomyocytes were analysed per experiment. (Right) Mean percentage of γH2AX foci co‐localising with telomeres (% TAF) in troponin‐C‐positive mouse embryonic cardiomyocytes at days 0, 3, 5 and 10 following 10 Gy X‐irradiation. Statistical analysis performed using one‐way ANOVA (Holm–Sidak method); *P < 0.05. Significant differences were found for mean number of non‐TAF, but not for mean number of TAF.
Mean number of both TAF and non‐TAF in neonatal rat cardiomyocytes at days 0, 3, 5, 10 days following treatment for 24 h with H2O2. Data are mean ± SEM of n = 3. > 50 cells were quantified per condition. Statistical analysis performed using one‐way ANOVA (Holm–Sidak method); **P < 0.01.
(Left) Representative images of γH2AX immuno‐FISH in H9C2 myoblasts 3 days 10 Gy X‐irradiation (red—telo‐FISH; green—γH2AX). White arrows identify areas shown in higher magnification panels. (Right) Mean number of both TAF and non‐TAF in H9C2 myoblasts at days 3 and 5 following 10 Gy X‐irradiation. Data are mean ± SEM of n = 3. > 50 cells were quantified per condition. Statistical analysis performed using one‐way ANOVA (Holm–Sidak method); ***P < 0.001. Scale bars represent 1 μm. Scale bars in single‐plane images 500 nm.
Representative time‐lapse images of H9C2 rat cardiomyoblasts expressing AcGFP‐53BP1 from 3 days after 10 Gy irradiation at the indicated times (min). Images are maximum intensity projections with a 6.7 μm focal depth. Scale bar represents 1 μm.
Kaplan–Meier survival curves for AcGFP‐53BP1c DDR foci in H9C2 cells 3 days after 10 Gy irradiation at 10‐min intervals for 24 h. > 500 foci from 10 cells were tracked per condition. Gehan–Breslow test was used, P < 0.001.
Schematic illustration showing 1‐month‐old C57BL/6 mice treated with 2 Gy whole‐body X‐irradiation, followed by a recovery period of 11 months before culling at 12 months of age. Mean number of TAF in α‐actinin‐positive cardiomyocytes. Data are mean ± SEM of n = 3 mice per group. Ninety α‐actinin‐positive cardiomyocytes were quantified per condition. Statistical analysis performed using two‐tailed t‐test; *P < 0.05.

- A
Representative images of rat neonatal CMs 4 days following transfection with a FLAG‐tagged TRF1‐FokI‐D450A (top row) or TRF1‐FokI (middle and bottom row) fusion protein (cell treatments the same for all subsequent panels in Figure; red—telo‐FISH; green—γH2A.X). Images are z‐projections of 0.1 μm stacks taken with 100× objective. White arrows indicate co‐localisation between telomeres and γH2A.X, with co‐localising foci amplified in the right panels (taken from single z‐planes where co‐localisation was found). Scale bar represents 3.5 μm. Scale bar in magnified images showing individual co‐localisation 500 nm.
- B, C
% of γH2A.X foci co‐localising with telomeres (B) and mean number of telomere‐associated foci (TAF) (C) in FLAG‐tagged TRF1‐FokI‐D450A‐ and TRF1‐FokI‐expressing CMs. Data are mean ± SEM of n = 4 independent experiments. > 50 cells were analysed per condition. Statistical analysis was performed by two‐tailed t‐test ***P < 0.001.
- D
Histograms displaying telomere intensity for telomeres co‐localising or not co‐localising with γH2AX foci. Red dotted lines represent median. Mann–Whitney test shows no significant difference in telomere intensity between TAF and non‐TAF.
- E
Mean % of FLAG‐labelled CMs positive for SA‐β‐Gal activity. Data are mean ± SEM of n = 3 independent experiments. > 100 cells were quantified per condition. Statistical analysis performed using two‐tailed t‐test; **P < 0.01.
- F
Expression of p21 mRNA (as a function of β‐actin and Gapdh) by real‐time PCR in TRF1‐FokI‐D450A and TRF1‐FokI‐expressing CMs. Data are mean ± SEM of n = 6 independent experiments. Statistical analysis performed using two‐tailed t‐test; ***P < 0.001.
- G
Mean ± SEM cell surface area (μm2) of FLAG‐labelled CMs expressing TRF1‐FokI‐D450A and TRF1‐FokI. Statistical analysis performed using two‐tailed t‐test; ***P < 0.001. Scale bar represents 50 μm.
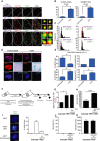
Representative images of H9C2 cardiomyoblasts 4 days following transfection with a FLAG‐tagged TRF1‐FokI‐D450A (top row) or TRF1‐FokI (middle and bottom row) fusion protein (cell treatments the same for all subsequent panels in figure; purple—FLAG; red—telo‐FISH; green—γH2A.X/53BP1). Images are z‐projections of 0.1 μm stacks taken with 100× objective. White arrows indicate co‐localisation between telomeres and γH2A.X/53BP1, with co‐localising foci amplified in the right panels (taken from single z‐planes where co‐localisation was found). Scale bars main image represent 2.5 μm. Scale bars single‐plane images 500 nm.
Percentage of γH2A.X (left) or 53BP1 (right) foci co‐localising with telomeres. Data are mean ± SEM of n = 3 independent experiments. More than 50 cells were analysed per condition. Statistical analysis was performed by two‐tailed t‐test; *P < 0.05.
Histograms displaying telomere intensity for telomeres co‐localising (bottom) or not co‐localising (top) with γH2AX (left) or 53BP1 (right) DDR foci. Red dotted lines represent median. Statistical analysis performed using two‐tailed t‐test. More than 50 cells were analysed per condition. Mann–Whitney tests show no significant difference in telomere intensity between TAF and non‐TAF, with either γH2A.X (left) or 53BP1 (right) DDR foci.
Representative images of detection of senescent markers (purple—FLAG; red—Ki‐67; light blue—DAPI; darker cytoplasmic blue—SA‐β‐Gal). Scale bar represents 10 μm.
Mean percentage of FLAG‐positive cells positive for Ki‐67, p21, SA‐β‐Gal activity and cell size. Data are mean ± SEM of n = 3 independent experiments. More than 100 cells were quantified per condition. For SA‐β‐Gal, data are presented as mean of > 100 cells representative of 1 experiment. Two additional independent experiments confirmed these findings (not shown). Statistical analysis performed using two‐tailed t‐test; *P < 0.05.
Scheme depicting experimental setting: AC10 human cardiomyocyte cell line stably expressing an inducible TRF1‐FokI was cultured for 2 weeks in mitogen‐depleted media which led to terminal differentiation and loss of proliferation. Then, cells were treated for 6 h with doxycycline (DOX), after which DOX was removed and cells were allowed to recover for 36 h.
Mean number of TAF following induction of TRF1‐FokI and recovery. Data are mean ± SEM of n = 4 independent experiments. Statistical analysis performed using one‐way ANOVA (Holm–Sidak method); *P < 0.05.
% of SA‐β‐Gal‐positive cells expressing TRF1‐FokI 36 h after 6 h DOX treatment. Data are mean ± SEM of n = 4 independent experiments. Statistical analysis performed using two‐tailed t‐test; *P < 0.001.
Forty‐eight hours post‐transfection, neonatal rat cardiomyocytes were stimulated with 4‐OH‐T (300 nM) during 6 h for nuclear re‐localisation of I‐PpoI and DSD induction. Analysis of γH2A.X was performed immediately after treatment and at day 4 post‐treatment. Data are mean ± SD from n = 50 cells per condition from two independent experiments. Scale bars represent 10 μm.
% of SA‐β‐Gal‐positive neonatal cardiomyocytes transfected with inducible I‐PpoI at day 4 post‐treatment. Data are mean ± SD from n = 50 cells per condition from two independent experiments.
Analysis of cell size in neonatal cardiomyocytes transfected with inducible I‐PpoI at day 4 post‐treatment. Data are mean ± SEM from n = 50 cells per condition from four independent experiments.
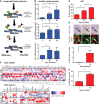
Scheme illustrating CM isolation and purification procedure.
Real‐time PCR gene expression analysis in isolated mouse CMs from C57BL/6 mice. Data are mean ± SEM of n = 3–4 per age group. Statistical analysis performed by one‐way ANOVA (Holm–Sidak method); *P < 0.05.
Mean % of p21‐positive CM nuclei from 3‐, 15‐ and 30‐month‐old C57BL/6 mice by immunohistochemistry (IHC). Data are mean ± SEM of n = 4 per age group. > 100 CMs were quantified per age group. Statistical analysis performed using one‐way ANOVA (Holm–Sidak method); *P < 0.05.
Mean % of 3‐ and 24‐month‐old mouse CMs staining positive for SA‐β‐Gal in vivo with representative images above (blue—SA‐β‐Gal; green—troponin‐C; red—WGA). Black arrows indicate SA‐β‐Gal expression in a troponin‐C‐expressing CM. Statistical analysis performed using two‐tailed t‐test; *P < 0.05. Data are mean ± SEM from the analysis of > 500 CMs per mouse, four mice per age group. Scale bar 20 μm.
Mean % of SADS‐positive CM nuclei from 3‐ and 30‐month‐old mouse CMs positive for SADS in vivo, as detected by centromere‐FISH. Data are mean ± SEM of n = 4 per age group. > 200 CMs per mouse were quantified. Statistical analysis performed using two‐tailed t‐test; *P < 0.05.
SASP heatmap: Pearson correlation clustered heatmap showing a curated list of known SASP genes (top panel) or a selection of secreted SASP proteins (bottom panel) in young (3 months) and old (20 months) mouse CMs (n = 5 per age group). The colour intensity represents column Z‐score, where red indicates highly and blue lowly expressed.
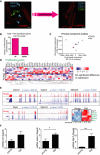
Representative images of cardiomyocytes isolations before (left) and after (right) purification to remove SCA1‐, CD31‐, and CD45‐positive cells. Scale bar represents 20 μm.
Counts of differentially expressed genes calculated using DESeq2 at % 5 FDR.
Principal component analysis (PCA) of FPKM expression for young (red) and old (blue) cardiomyocytes. Components one and two account for 80.1 and 7.8% of the total variance, respectively.
Correlation clustered heatmap of a curated list of known proliferation genes in young and old cardiomyocytes. The colour intensity represents column Z‐score, with red indicating high expression and blue low expression. Note that there is no enrichment for differential expression in this subset of pro‐proliferation genes.
Trace plots and heatmap of the relative expression of Ankrd1, Capn3, Mybcp2, Myot, Myom3 and their associated FDR‐corrected q‐values derived from DESeq2.
Confirmatory RT–PCRs showing changes in cardiac hypertrophy genes Acta1 and Myh7, but not Anf. Data were normalised to Gapdh. Data are mean ± SEM of n = 4–5 mice per age group. Two‐tailed t‐test was used. **P < 0.01; *P < 0.05.
- A
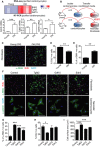
(Above) RNA sequencing of purified CMs from four mice per age group reveals age‐dependent increased expression of three secreted proteins Edn3, Tgfb2 and Gdf15; the colour intensity represents column Z‐score, where red indicates highly and blue lowly expressed. (Below) mRNA expression of Edn3, Tgfb2 and Gdf15 was independently validated by RT–PCR in young and old isolated adult CMs. Data are mean ± SEM of n = 5 mice per group.
- B
CMs were isolated by Langendorff heart perfusion, purified and cultured for 48 h. Conditioned medium (CM) was collected and added to cultures of neonatal fibroblasts in the presence of 10 μM EdU.
- C
Representative images of immunofluorescent staining against α‐SMA and EdU in neonatal fibroblasts cultured in the presence of CM from young and old CMs.
- D, E
Quantification of % of EdU incorporation (D) and % of a‐SMA‐positive cells (E) in neonatal fibroblasts after treatment for 48 h with CM from young and old CM. Data are mean ± SEM of n = 3–4 mice per age group; > 200 cells were quantified per condition.
- F
Representative micrographs of neonatal fibroblasts and CMs treated with recombinant proteins: Tgfb2, Edn3 and Gdf15 for 48 h and immunostained against α‐SMA and EdU (fibroblasts) and α‐actinin (CMs).
- G–I
Quantification of α‐SMA‐ (G) and EdU‐positive neonatal fibroblasts (H) and surface area (μm2) (I) in neonatal CMs following treatment with the indicated recombinant proteins. Data are mean ± SEM of n = 3–4 independent experiments.
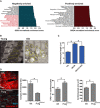
Normalised GSEA enrichment scores for the top 20 positively and negatively enriched GO ontologies. Those negatively enriched ontologies associated with mitochondrial structure and function are highlighted in red.
Transmission electron microscopy to detect mitochondrial ultrastructural defects in young (3 months) and old (20 months) mice. Scale bars represent 500 nm.
Cardiomyocyte length analysis on WT, MAO‐A or MAO‐A mice with or without drinking water supplemented with 1.5 g/kg/day NAC from the age of 4–24 weeks. Data are mean ± SEM of n = 5–10 mice per group.
Representative images of mitochondrial complex IV (red) and WGA (blue) in 12‐month‐old WT and Polgmut/mut mice. Graphs represent complex IV intensity (left), p21 positivity by immunohistochemistry and mean cardiomyocyte area (right). Data are mean ± SEM of n = 3–5 mice per group. More than 100 cardiomyocytes were quantified per group. Scale bar represents 20 μm.

- A
Mito and ETC genes with GSEA analysis: Clustered heatmap showing all genes associated with the “Mitochondrion” GO term in young and old, mouse CMs as observed by the GSEA pre‐ranked list enrichment analysis (normalised enrichment score: −1.70; FDR q‐value < 0.05). Alongside this is a column clustered heatmap displaying a list of genes from the electron transport chain (ETC) GO ontology. In both instances, genes are by column and samples by row with the colour intensity representing column Z‐score, where red indicates highly and blue lowly expressed.
- B
Real‐time PCR gene expression analysis of MAO‐A, MnSOD and catalase in isolated mouse CMs from young (3 months) and old (20 months) mice. Data are mean ± SEM of n = 4–5 per age group. Asterisks denote a statistical significance at P < 0.05 using two‐tailed t‐test.
- C
Mean % of 4‐HNE‐ (top) or 8‐oxodG‐positive (bottom) CMs from 3 month (young) or 30 month (old) mice. Data are mean ± SEM of n = 4 per age group. 100 CMs were quantified per age group. Asterisks denote a statistical significance at P < 0.05 using two‐tailed t‐test.
- D–G
Mean % of TAF‐positive nuclei (left graphs) or mean % of TAF (right graphs) in wild‐type (control) compared to MAO‐A transgenic mice with or without drinking water supplemented with 1.5 g/kg/day NAC from the age of 4–24 weeks, MnSOD+/+ vs MnSOD−/+, Catalase+/+ vs Catalase−/−, WT vs POLG double‐mutant mice. Data are mean ± SEM of n = 3–4 per group. > 100 CMs were quantified per age group. Statistical analysis was performed using two‐tailed t‐test (E–G) or one‐way ANOVA (for multiple comparisons) (D); *P < 0.05.
- H
Scheme depicting isolated mouse adult CMs isolated from four animals were treated with or without 100 nM rotenone either in the presence of 5 mM NAC or vehicle control (pre‐treated for 30 min before rotenone treatment), for 24 h before fixation. Mean number of TAF (top graph) and mean % of TAF‐positive nuclei (bottom graph). Data are mean ± SEM from four separate CM cultures isolated from 3‐month‐old mice. Fifty CMs were quantified per condition. Asterisks denote a statistical significance at P < 0.05 using one‐way ANOVA (Holm–Sidak method).

Examples of individual short‐axis cine‐MR images of 3‐month‐old or 20‐month‐old mouse hearts. Ejection fraction and LV thickness were calculated based on manual measurements of left ventricle epicardial and endocardial borders. % change in wall thickening calculation based on wall thickness at the four points indicated. Measurements were made in all cine slices at end diastole and end systole. Graphs representing data obtained from MRI analysis of > 7 animals per age group. Data are mean ± SEM. Asterisks denote a statistical significance at P < 0.05 using Mann–Whitney U‐test. Scale bars represent 5 mm.
Comparison between mean number of TAF per CM and CM area in 22‐month‐old animals. Data are mean ± SEM of n = 4. > 100 CMs were quantified per mouse. Statistical analysis performed using one‐way ANOVA (Holm–Sidak method); *P < 0.05.
Scheme depicting experimental design for (D–F): 27‐month‐old INK‐ATTAC mice were treated 4 times with AP20187 (or vehicle), 3 days in a row, every 2 weeks (2‐month‐long treatment in total) and were sacrificed afterwards for analysis.
Comparison between the % of p16‐ or eGFP‐positive CMs by RNA in situ hybridisation per plane in INK‐ATTAC mice (28–29 months old) treated with vehicle or AP20187. Data are mean ± SEM of n = 5 per age group. 100 CMs were analysed per mouse. Asterisks denote a statistical significance at *P < 0.05 or ***P < 0.001 using two‐tailed t‐test.
Mean number of TAF (left graph) and mean % of TAF‐positive nuclei (right graph) in CMs. Data are mean ± SEM of n = 6 per age group. 100 CMs were analysed per mouse. ***P < 0.001; **P < 0.01; *P < 0.05.
Mean CM area μm2. Data are mean ± SEM of n = 6 per age group, > 150 CMs analysed per mouse. Asterisks denote a statistical significance at *P < 0.05 using two‐tailed t‐test.
% of fibrotic area evaluated by Sirius Red staining. Data are mean ± SEM of n = 6 per age group. Asterisks denote a statistical significance using Mann–Whitney test. ***P < 0.001.

Histograms showing distribution of individual telomere intensities measured by Q‐FISH comparing TAF and non‐TAF in INK‐ATTAC mice (28–29 months old) treated with vehicle or AP20187. > 150 cardiomyocytes were analysed per mouse.
Representative image of Sirius Red staining in old INK‐ATTAC mice treated AP20187 (or vehicle) at 29 months of age. Scale bar represents 50 μm.
Ejection fraction in old INK‐ATTAC treated with or without AP. Data are mean ± SEM of 11–12 mice per group.
Mean telomere FISH intensity in 23‐month‐old mice with or without navitoclax treatment. Data are mean ± SEM of n = 3 per treatment group.
H9C2 cardiomyoblasts were induced to senescence (representative Sen‐β‐Gal image) via exposure to 10 Gy X‐ray radiation. Scale bar represents 50 μm.
Navitoclax treatment significantly reduced cell viability in senescent cardiomyoblasts in a dose‐dependent manner. Navitoclax had no effect on the viability of non‐senescent cardiomyoblasts. Data are mean ± SEM n = 3 for each treatment group and dosage. Statistical analysis via two‐way ANOVA; *P < 0.05.
Distribution of cardiomyocyte cross‐sectional area in 23‐month‐old mice treated or not with navitoclax. Data show that most cardiomyocytes with areas above 650 μm2 are not detected following navitoclax and smaller cardiomyocytes with areas below 100 μm2 emerge. Seven animals per group were analysed.
Quantification of Ki‐67 positive cardiomyocytes in vehicle‐ and navitoclax‐treated animals. Data are mean ± SEM of n = 3 per treatment group.

- A
Scheme depicting experimental design. Mice at 100 weeks (23 months) of age were treated with vehicle (Veh) or navitoclax (Nav) intermittently for 2 weeks. At 104 weeks, mice were injected every day with EdU for 1 week.
- B
Quantification of mean number of TAF and % of TAF‐positive CMs in 24‐month‐old wild‐type mice treated with vehicle or navitoclax (50 mg/kg/day). Data are mean ± SEM of n = 5–8 mice per group. More than 100 CMs were quantified per animal.
- C
CM cross‐sectional area in 24‐month‐old wild‐type mice treated with vehicle or navitoclax. Data are mean ± SEM of n = 8 mice per group.
- D
(Left) Representative images of Sirius red staining and (right) % of fibrosis area in 24‐month‐old mice treated or not with navitoclax. Data are mean ± SEM of n = 3 per group. Scale bar represents 50 μm.
- E–G
MRI analysis of ejection fraction (EF%), left ventricle mass (LVmass) index and % of ventricle wall thickness (%WTC) in 24‐month‐old mice treated or not with navitoclax. Data are mean ± SEM of n = 6 mice per treatment group.
- H
Examples of confocal microscopy images of CMs positive for CM marker troponin‐C (TropC), EdU, Ki‐67, and Aurora B from navitoclax‐treated animals. In the upper right panel, white arrows identify two nuclei in the same CM that have incorporated EdU. In the lower right panel, white arrows identify EdU‐expressing Aurora B symmetrically between two nuclei. Scale bars represent 20 μm.
- I
Table summarising numbers of CMs quantified in (J).
- J
Quantification of EdU‐positive CMs (mono‐ or multi‐nucleated) in vehicle‐ and navitoclax‐treated animals. Data are mean ± SEM of n = 5–6 mice per group.
- K
% of Ki‐67‐positive CMs in 29‐month‐old INK‐ATTAC mice treated with vehicle or AP20187. Data are mean ± SEM of n = 4–6 mice per group.
Comment in
-
Length doesn't matter-telomere damage triggers cellular senescence in the ageing heart.EMBO J. 2019 Mar 1;38(5):e101571. doi: 10.15252/embj.2019101571. Epub 2019 Feb 15. EMBO J. 2019. PMID: 30770342 Free PMC article.
Similar articles
-
Selective Cardiomyocyte Oxidative Stress Leads to Bystander Senescence of Cardiac Stromal Cells.Int J Mol Sci. 2021 Feb 24;22(5):2245. doi: 10.3390/ijms22052245. Int J Mol Sci. 2021. PMID: 33668142 Free PMC article.
-
Telomeres and telomerase in risk assessment of cardiovascular diseases.Exp Cell Res. 2020 Dec 15;397(2):112361. doi: 10.1016/j.yexcr.2020.112361. Epub 2020 Nov 7. Exp Cell Res. 2020. PMID: 33171154 Review.
-
Molecular Aspects of Senescence and Organismal Ageing-DNA Damage Response, Telomeres, Inflammation and Chromatin.Int J Mol Sci. 2021 Jan 8;22(2):590. doi: 10.3390/ijms22020590. Int J Mol Sci. 2021. PMID: 33435578 Free PMC article. Review.
-
Postmitotic neurons develop a p21-dependent senescence-like phenotype driven by a DNA damage response.Aging Cell. 2012 Dec;11(6):996-1004. doi: 10.1111/j.1474-9726.2012.00870.x. Epub 2012 Sep 12. Aging Cell. 2012. PMID: 22882466 Free PMC article.
-
The roles of senescence and telomere shortening in cardiovascular disease.Nat Rev Cardiol. 2013 May;10(5):274-83. doi: 10.1038/nrcardio.2013.30. Epub 2013 Mar 12. Nat Rev Cardiol. 2013. PMID: 23478256 Review.
Cited by
-
Telomeres, cellular senescence, and aging: past and future.Biogerontology. 2024 Apr;25(2):329-339. doi: 10.1007/s10522-023-10085-4. Epub 2023 Dec 27. Biogerontology. 2024. PMID: 38150087 Free PMC article. Review.
-
Deficiency of telomere-associated repressor activator protein 1 precipitates cardiac aging in mice via p53/PPARα signaling.Theranostics. 2021 Mar 4;11(10):4710-4727. doi: 10.7150/thno.51739. eCollection 2021. Theranostics. 2021. PMID: 33754023 Free PMC article.
-
Targeted clearance of p21- but not p16-positive senescent cells prevents radiation-induced osteoporosis and increased marrow adiposity.Aging Cell. 2022 May;21(5):e13602. doi: 10.1111/acel.13602. Epub 2022 Apr 1. Aging Cell. 2022. PMID: 35363946 Free PMC article.
-
JAK/STAT signaling in diabetic kidney disease.Front Cell Dev Biol. 2023 Aug 11;11:1233259. doi: 10.3389/fcell.2023.1233259. eCollection 2023. Front Cell Dev Biol. 2023. PMID: 37635867 Free PMC article. Review.
-
Cellular senescence and senolytics: the path to the clinic.Nat Med. 2022 Aug;28(8):1556-1568. doi: 10.1038/s41591-022-01923-y. Epub 2022 Aug 11. Nat Med. 2022. PMID: 35953721 Free PMC article. Review.
References
-
- Acosta JC, Banito A, Wuestefeld T, Georgilis A, Janich P, Morton JP, Athineos D, Kang T‐W, Lasitschka F, Andrulis M, Pascual G, Morris KJ, Khan S, Jin H, Dharmalingam G, Snijders AP, Carroll T, Capper D, Pritchard C, Inman GJ et al (2013) A complex secretory program orchestrated by the inflammasome controls paracrine senescence. Nat Cell Biol 15: 978–990 - PMC - PubMed
-
- d'Adda di Fagagna F, Reaper PM, Clay‐Farrace L, Fiegler H, Carr P, von Zglinicki T, Saretzki G, Carter NP, Jackson SP (2003) A DNA damage checkpoint response in telomere‐initiated senescence. Nature 426: 194–198 - PubMed
-
- Anderson R, Richardson GD, Passos JF (2018) Mechanisms driving the ageing heart. Exp Gerontol 109: 5–15 - PubMed
-
- Bae NS, Baumann P (2007) A RAP1/TRF2 complex inhibits nonhomologous end‐joining at human telomeric DNA ends. Mol Cell 26: 323–334 - PubMed
Publication types
MeSH terms
Substances
Grants and funding
- PG/14/86/31177/BHF_/British Heart Foundation/United Kingdom
- R01 HL141819/HL/NHLBI NIH HHS/United States
- R37 AG013925/AG/NIA NIH HHS/United States
- MR/L016354/1/MRC_/Medical Research Council/United Kingdom
- P01 AG031862/AG/NIA NIH HHS/United States
- PG/15/85/31744/BHF_/British Heart Foundation/United Kingdom
- R01 AG013925/AG/NIA NIH HHS/United States
- PG/19/15/34269/BHF_/British Heart Foundation/United Kingdom
- G0700718/MRC_/Medical Research Council/United Kingdom
- BB/H022384/1/BB_/Biotechnology and Biological Sciences Research Council/United Kingdom
LinkOut - more resources
Full Text Sources
Other Literature Sources
Molecular Biology Databases

