. 2019 Apr 1;30(8):1037-1049.
doi: 10.1091/mbc.E18-12-0793. Epub 2019 Feb 6.

MAPK modulation of yeast pheromone signaling output and the role of phosphorylation sites in the scaffold protein Ste5

Affiliations

MAPK modulation of yeast pheromone signaling output and the role of phosphorylation sites in the scaffold protein Ste5

Matthew J Winters et al. Mol Biol Cell. .

Abstract

Mitogen-activated protein kinases (MAPKs) mediate numerous eukaryotic signaling responses. They also can modulate their own signaling output via positive or negative feedback loops. In the yeast pheromone response pathway, the MAPK Fus3 triggers negative feedback that dampens its own activity. One target of this feedback is Ste5, a scaffold protein that promotes Fus3 activation. Binding of Fus3 to a docking motif (D motif) in Ste5 causes signal dampening, which was proposed to involve a central cluster of phosphorylation sites in Ste5. Here, we reanalyzed the role of these central sites. Contrary to prior claims, phosphorylation-mimicking mutations at these sites did not impair signaling. Also, the hyperactive signaling previously observed when these sites were mutated to nonphosphorylatable residues arose from their replacement with valine residues and was not observed with other substitutes. Instead, a cluster of N-terminal sites in Ste5, not the central sites, is required for the rapid dampening of initial responses. Further results suggest that the role of the Fus3 D motif is most simply explained by a tethering effect that promotes Ste5 phosphorylation, rather than an allosteric effect proposed to regulate Fus3 activity. These findings substantially revise our understanding of how MAPK feedback attenuates scaffold-mediated signaling in this model pathway.


Figures
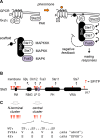
FIGURE 1:
FIGURE 1:
Pheromone response and negative feedback. (A) The pheromone response pathway. Binding of pheromone to the GPCR triggers dissociation of the G protein heterotrimer (Gαβγ). The free Gβγ dimer then stimulates membrane recruitment of the scaffold protein, Ste5. A cascade of kinase activation ultimately activates the MAPK Fus3, which stimulates both downstream mating responses and negative feedback, which dampens the response. Ste5 is one of several targets of Fus3-mediated negative feedback. (B) Domain structure of Ste5. Names of domains and motifs are shown below the linear structure, and their binding targets are indicated above. SP/TP motifs, which represent minimal phosphorylation sites for MAPKs and CDKs, are marked in red. (C) Ste5 has two clusters of SP/TP sites. The central cluster was originally implicated as a target of Fus3 negative feedback. In those studies, the Thr and Ser sites were mutated to nonphosphorylatable Val and Ala residues, designated 2V2A (or “abcd” in Malleshaiah et al., 2010), as well as to phosphomimetic Glu residues, designated 4E (or “EFGH” in Malleshaiah et al., 2010).
FIGURE 2:
FIGURE 2:
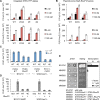
The Ste5-4E mutant is not impaired at signaling. (A) Strains with integrated STE5-YFPx3 alleles were tested for Fus3 phosphorylation (15 min; mean ± SEM, n = 4) and FUS1-lacZ transcription (90 min; mean ± SD, n = 3) in response to varying α-factor doses. Strains: MWY001, MWY060, MWY056, MWY352. Plasmid: pSB231. (B) Plasmid-borne Ste5-RlucF2 fusions were assayed for Fus3 phosphorylation (15 min; mean ± SEM, n = 4) and FUS1-lacZ transcription (90 min; mean ± SD, n = 4). Strain: TCY3106. Plasmids: pPP1044, pSH95-MM100, pSH95-MM115, pSH95-MM130. (C) Transcription was measured for plasmid-borne alleles of Ste5 (WT, 4E) in four contexts. Left, BY4741 strains with FUS3-WT or a FUS3-RlucF1 fusion, treated ± α factor (1 µM, 90 min). Right, W303 kss1∆ strains with FUS3-WT or PCYC1-FUS3, treated ± α factor (100 nM, 90 min). Bars, mean ± SD (n = 4), normalized for each strain background. Strains: PPY2271, MM003, PPY2389, PPY2412. Plasmids: pPP1044, pPP1969, pPP4315. (D) Transcriptional induction by plasmid-borne Ste5 alleles, with (+) or without (–) an RlucF2 fusion, tested in two backgrounds: BY4741 (BAR1; 1 µM α factor, 90 min) and W303 (bar1∆; 10 nM α factor, 90 min). Bars, mean ± SD (n = 4), normalized for each background. The WT plasmid lacking RlucF2 is the direct progenitor of the fusion constructs. Strains: PPY2271, PPY2365. Plasmids: pPP1044, pRS316, pSH95, pSH95-MM100, pSH95-MM130. (E) Strains with RlucF1 and RlucF2 fusions (Malleshaiah et al., 2010) were compared with the parental strain BY4741 in assays of cell-cycle arrest (halo assay using 4 and 20 nM α factor), mating, and transcription (mean ± SD, n = 3). Strains: BY4741, MM002, MM003, MM008, MM009. Mating partner: PT2α. Plasmid: pSB231.
FIGURE 3:
FIGURE 3:
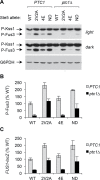
Deletion of PTC1 reduces signaling irrespective of the status of central sites in Ste5. (A) Phospho-MAPK analysis in PTC1 vs. ptc1∆ strains harboring the indicated Ste5 alleles, following treatment with 10 nM α factor (15 min). Strains: TCY3106, MWY393. Plasmids: pPP1044, pPP1969, pPP3044, pPP4314, pPP4315. (B) Quantification of phospho-Fus3 signal from experiments as in (A) (mean ± SD, n = 4). (C) Transcriptional induction was measured after 90 min α-factor treatment, in parallel with the assays above (mean ± SD, n = 4).
FIGURE 4:
FIGURE 4:
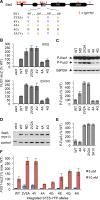
Signaling phenotypes of nonphosphorylatable Ste5 mutants depends on the substitute residue. (A) Diagram of residue substitutions in the Ste5 mutants tested below. (B) Transcriptional induction by plasmid-borne Ste5 alleles was assayed after 90 min α-factor treatment in two strain backgrounds: W303 (bar1∆; 10 nM α factor) and BY4741 (BAR1; 1 µM α factor). Bars, mean ± SD (n = 4). Strains: PPY2271, PPY2365. Plasmids: pRS316, pPP1044, pPP1969, pPP3044, pPP4314, pPP4316, pPP4317, pPP4318. (C) Phospho-MAPK levels in W303 background cells from B (10 nM α factor, 30 min). Top, representative blots. Bottom, quantified results (mean ± SEM, n = 4). (D) Ste5-myc13 levels in the cells from B (top). A nonspecific band on the same blot served as a loading control. (E) The Ste5-3A1V mutant is as hyperactive as the 4V and 2V2A mutants. Fus3 phosphorylation was measured after 15 min treatment with 10 nM α factor. Bars, mean ± SEM (n = 4). Strain: PPY2365. Plasmids: pPP1044, pPP1969, pPP4314, pPP4316, pPP4317, pPP4378. (F) Transcriptional induction in strains with integrated STE5-YFPx3 alleles after treatment with 3 or 10 nM α factor (90 min). Bars, mean ± SD (n = 4). Strains: MWY001, MWY056, MWY060, MWY352, MWY397, MWY399, MWY401, MWY403. Plasmid: pSB231.
FIGURE 5:
FIGURE 5:
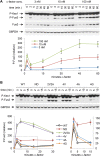
Temporal attenuation of signaling requires the Fus3 D motif but not the central phosphorylation sites in Ste5. (A) Temporal dynamics of MAPK phosphorylation was assayed at three different pheromone concentrations. Top, representative example. Bottom, quantified results (mean ± SEM, n = 4), expressed relative to the 2-min peak with 10 nM α factor. Strain: PPY2365. Plasmids: pPP1044 and pPP1969. (B) MAPK phosphorylation dynamics for cells harboring the indicated Ste5 mutants, treated with 10 nM α factor. Top, representative example. Bottom, quantified results (mean ± SEM, n = 4). The dashed region in the left plot is expanded at the right to facilitate comparison of that subset. Strain: PPY2365. Plasmids: pPP1044, pPP1969, pPP3044, pPP4314, pPP4316, pPP4317, pPP4318.
FIGURE 6:
FIGURE 6:
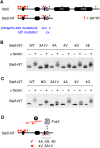
Valine mutations disrupt pheromone-induced phosphorylation of distal sites in Ste5. (A) Diagram of full-length Ste5 and the Ste5-NT fragment used to detect phosphorylation by mobility shift assays. At bottom are shown the sites of mutations tested in assays below. (B) Mobility shift assays of phosphorylation for Ste5-NT fragments harboring the indicated mutations. Cells were synchronized in G1 (by arresting cdc15-2 cells in mitosis and releasing for 20 min) and then treated briefly ± α factor (1 µM, 5 min) Strain: MWY198. Plasmids: pPP3415, pPP4235, pPP4236, pPP4324, pPP4325, pPP4326. (C) Assays were performed as in B, but here included Ste5-ND (pPP4358) for comparison. (D) Illustration summarizing the results above. Valine substitutions at the central sites have a side effect of disrupting Fus3 phosphorylation of other sites in the Ste5 N-terminus.
FIGURE 7:
FIGURE 7:
Role for N-terminal phosphorylation sites in dampening signal output. (A) Fus3 activation dynamics for cells harboring the indicated Ste5-YFPx3 mutants treated with 50 nM α factor. The Ste5-8A mutation, lacking the eight N-terminal phosphorylation sites, was tested alone and in combination with the ND mutation (8A+ND). Top, representative example. Bottom, quantified results (mean ± SEM, n = 8). Strains: MWY001, MWY006, MWY038, MWY042. (B) Representative example of MAPK phosphorylation and Ste5-YFPx3 protein levels for variants that combine phosphorylation site mutations with the ND mutation. Cells were treated with 10 nM α factor for 15 min. Strains: TCY3106, MWY001, MWY006, MWY038, MWY042, MWY056, MWY060, MWY159, MWY397, MWY407, MWY409, MWY412, MWY413. All strains harbored plasmid pSB231. (C) Top, quantification of P-Fus3 levels from experiments as in B (mean ± SEM, n = 6). Middle, FUS1-lacZ levels in the same strains, after treatment with the indicated α-factor concentrations for 90 min (mean ± SEM, n = 6). Bottom, quantification of Ste5-YFP levels in the same strains (mean ± SEM, n = 5).
FIGURE 8:
FIGURE 8:
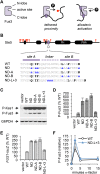
Features of the Fus3 D motif required to control signaling output. (A) Docking of Fus3 onto Ste5 can potentially contribute to negative feedback by two routes. It can enhance phosphorylation of sites in Ste5 by increasing their local proximity. It can also partially activate Fus3, whereby contacts with both N- and C-lobes of the kinase induce an allosteric change in conformation that promotes autophosphorylation. (B) The D motif in Ste5 consists of two Fus3-contacting regions (sites A and B) separated by a linker. Lowercase letters show mutations in the original ND mutant, in half-site mutants (ND-A, ND-B) and in a mutant with a lengthened linker (ND-L+3). (C–E) Cells harboring plasmid-borne Ste5 alleles were treated with α factor (10 nM) and assayed for MAPK phosphorylation (15 min) and transcriptional induction (90 min). (C) Representative immunoblots. (D, E) Quantified P-Fus3 and FUS1-lacZ results (mean ± SEM, n = 4). Strain: PPY2365. Plasmids, pRS316, pPP1044, pPP1969, pPP3044, pPP4380, pPP4381, pPP4401. (F) Time course of Fus3 phosphorylation in the strains from C–E harboring WT Ste5 or the ND-L+3 mutant, following treatment with 10 nM α factor (mean ± SEM, n = 4).

Similar articles

Cited by

References

    1. Alvaro CG, Thorner J. (2016). Heterotrimeric G protein-coupled receptor signaling in yeast mating pheromone response. J Biol Chem , 7788–7795. - PMC - PubMed
    1. Bardwell L. (2005). A walk-through of the yeast mating pheromone response pathway. Peptides , 339–350. - PMC - PubMed
    1. Bhaduri S, Pryciak PM. (2011). Cyclin-specific docking motifs promote phosphorylation of yeast signaling proteins by G1/S Cdk complexes. Curr Biol , 1615–1623. - PMC - PubMed
    1. Bhaduri S, Valk E, Winters MJ, Gruessner B, Loog M, Pryciak PM. (2015). A docking interface in the cyclin Cln2 promotes multi-site phosphorylation of substrates and timely cell-cycle entry. Curr Biol , 316–325. - PMC - PubMed
    1. Bhattacharyya RP, Remenyi A, Good MC, Bashor CJ, Falick AM, Lim WA. (2006). The Ste5 scaffold allosterically modulates signaling output of the yeast mating pathway. Science , 822–826. - PubMed

Publication types

MeSH terms

Substances

LinkOut - more resources