Pomalidomide increases immune surface marker expression and immune recognition of oncovirus-infected cells
- PMID: 30713808
- PMCID: PMC6343774
- DOI: 10.1080/2162402X.2018.1546544
Pomalidomide increases immune surface marker expression and immune recognition of oncovirus-infected cells
Abstract
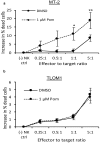
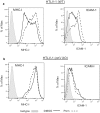
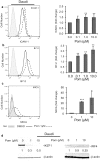
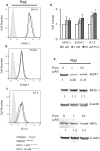
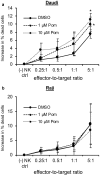
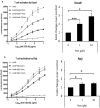
Most chronic viruses evade T-cell and natural killer (NK) immunity through downregulation of immune surface markers. Previously we showed that Pomalidomide (Pom) increases surface expression of major histocompatibility complex class I (MHC-I) in Kaposi sarcoma-associated herpesvirus-infected latent and lytic cells and restores ICAM-1 and B7-2 in latent cells. We explored the ability of Pom to increase immune surface marker expression in cells infected by other chronic viruses, including human T-cell leukemia virus type-1 (HTLV-1), Epstein-Barr virus (EBV), human papilloma virus (HPV), Merkel cell polyoma virus (MCV), and human immunodeficiency virus type-1 (HIV-1). Pom increased MHC-1, ICAM-1, and B7-2/CD86 in immortalized T-cell lines productively infected with HTLV-1 and also significantly increased their susceptibility to NK cell-mediated cytotoxicity. Pom enhancement of MHC-I and ICAM-1 in primary cells infected with HTLV-1 was abrogated by knockout of HTLV-1 orf-1. Pom increased expression of ICAM-1, B7-2 and MHC class I polypeptide related sequence A (MICA) surface expression in the EBV-infected Daudi cells and increased their T-cell activation and susceptibility to NK cells. Moreover, Pom increased expression of certain of these surface markers on Akata, Raji, and EBV lymphoblastic cell lines. The increased expression of immune surface markers in these virus-infected lines was generally associated with a decrease in IRF4 expression. By contrast, Pom treatment of HPV, MCV and HIV-1 infected cells did not increase these immune surface markers. Pom and related drugs may be clinically beneficial for the treatment of HTLV-1 and EBV-induced tumors by rendering infected cells more susceptible to both innate and adaptive host immune responses.
Keywords: CD86; ICAM-1; Natural killer (NK) cells; T cells; epstein barr virus (EBV); human T lymphotropic virus type 1 (HTLV-1); ikaros (IKZF1).; interferon regulatory factor 4 (IRF4); major histocompatibility complex class I (MHC-I); pomalidomide.
Figures



Similar articles
-
Transient Viral Activation in Human T Cell Leukemia Virus Type 1-Infected Macaques Treated With Pomalidomide.Front Med (Lausanne). 2022 May 5;9:897264. doi: 10.3389/fmed.2022.897264. eCollection 2022. Front Med (Lausanne). 2022. PMID: 35602479 Free PMC article.
-
Restoration of immune surface molecules in Kaposi sarcoma-associated herpes virus infected cells by lenalidomide and pomalidomide.Oncotarget. 2017 May 17;8(31):50342-50358. doi: 10.18632/oncotarget.17960. eCollection 2017 Aug 1. Oncotarget. 2017. PMID: 28881567 Free PMC article.
-
CDK4/6 inhibitors sensitize gammaherpesvirus-infected tumor cells to T-cell killing by enhancing expression of immune surface molecules.J Transl Med. 2022 May 13;20(1):217. doi: 10.1186/s12967-022-03400-z. J Transl Med. 2022. PMID: 35562811 Free PMC article.
-
Lymphotropic viruses, Epstein-Barr virus (EBV) and human T-cell lymphotropic virus-I (HTLV-I)/adult T-cell leukemia virus (ATLV), and HTLV-III/human immune deficiency virus (HIV) as etiological agents of malignant lymphoma and immune deficiency.AIDS Res. 1986 Dec;2 Suppl 1:S1-6. AIDS Res. 1986. PMID: 2881552 Review.
-
The innate and T-cell mediated immune response during acute and chronic gammaherpesvirus infection.Front Cell Infect Microbiol. 2023 Mar 31;13:1146381. doi: 10.3389/fcimb.2023.1146381. eCollection 2023. Front Cell Infect Microbiol. 2023. PMID: 37065193 Free PMC article. Review.
Cited by
-
Hypoxic reactivation of Kaposi's sarcoma associated herpesvirus.Cell Insight. 2024 Sep 7;3(6):100200. doi: 10.1016/j.cellin.2024.100200. eCollection 2024 Dec. Cell Insight. 2024. PMID: 39391006 Free PMC article. Review.
-
Role of HTLV-1 orf-I encoded proteins in viral transmission and persistence.Retrovirology. 2019 Dec 18;16(1):43. doi: 10.1186/s12977-019-0502-1. Retrovirology. 2019. PMID: 31852543 Free PMC article. Review.
-
Transient Viral Activation in Human T Cell Leukemia Virus Type 1-Infected Macaques Treated With Pomalidomide.Front Med (Lausanne). 2022 May 5;9:897264. doi: 10.3389/fmed.2022.897264. eCollection 2022. Front Med (Lausanne). 2022. PMID: 35602479 Free PMC article.
-
Mechanism and therapeutic implications of pomalidomide-induced immune surface marker upregulation in EBV-positive lymphomas.Sci Rep. 2023 Jul 18;13(1):11596. doi: 10.1038/s41598-023-38156-z. Sci Rep. 2023. PMID: 37463943 Free PMC article.
-
Ficus carica Latex Modulates Immunity-Linked Gene Expression in Human Papillomavirus Positive Cervical Cancer Cell Lines: Evidence from RNA Seq Transcriptome Analysis.Int J Mol Sci. 2023 Sep 4;24(17):13646. doi: 10.3390/ijms241713646. Int J Mol Sci. 2023. PMID: 37686451 Free PMC article.
References
-
- Polizzotto MN, Uldrick TS, Wyvill KM, Aleman K, Peer CJ, Bevans M, Sereti I, Maldarelli F, Whitby D, Marshall V, et al. Pomalidomide for symptomatic kaposi’s sarcoma in people with and without HIV infection: a phase I/II study. J Clin Oncol. 2016;34:4125–4131. doi:10.1200/JCO.2016.69.3812. - DOI - PMC - PubMed
-
- Pourcher V, Desnoyer A, Assoumou L, Lebbe C, Curjol A, Marcelin AG, Cardon F, Gibowski S, Salmon D, Chennebault J-M, et al. Phase II trial of lenalidomide in HIV-infected patients with previously treated kaposi’s sarcoma: results of the ANRS 154 lenakap trial. AIDS Res Hum Retroviruses. 2017;33:1–10. doi:10.1089/AID.2016.0069. - DOI - PubMed
-
- Shimabukuro K, Moore PC, Bui J, D’ittmer D, Ambinder R, Martinez-Maza O, et al. Lenalidomide is safe and effective in aids-associated kaposi sarcoma. 16th International Conference on Malignancies in HIV/AIDS; 2017; Bethesda, MD: National Cancer Institute.
Publication types
Grants and funding
LinkOut - more resources
Full Text Sources
Research Materials
Miscellaneous
