. 2019 Jan 24:2:35.
doi: 10.1038/s42003-019-0282-0. eCollection 2019.

A high-throughput microscopy method for single-cell analysis of event-time correlations in nanoparticle-induced cell death

Affiliations

A high-throughput microscopy method for single-cell analysis of event-time correlations in nanoparticle-induced cell death

Alexandra Murschhauser et al. Commun Biol. .

Abstract

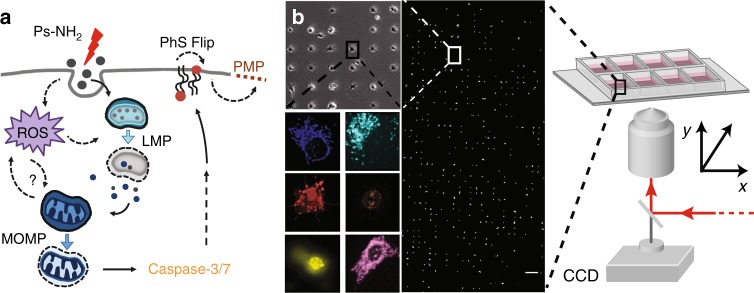
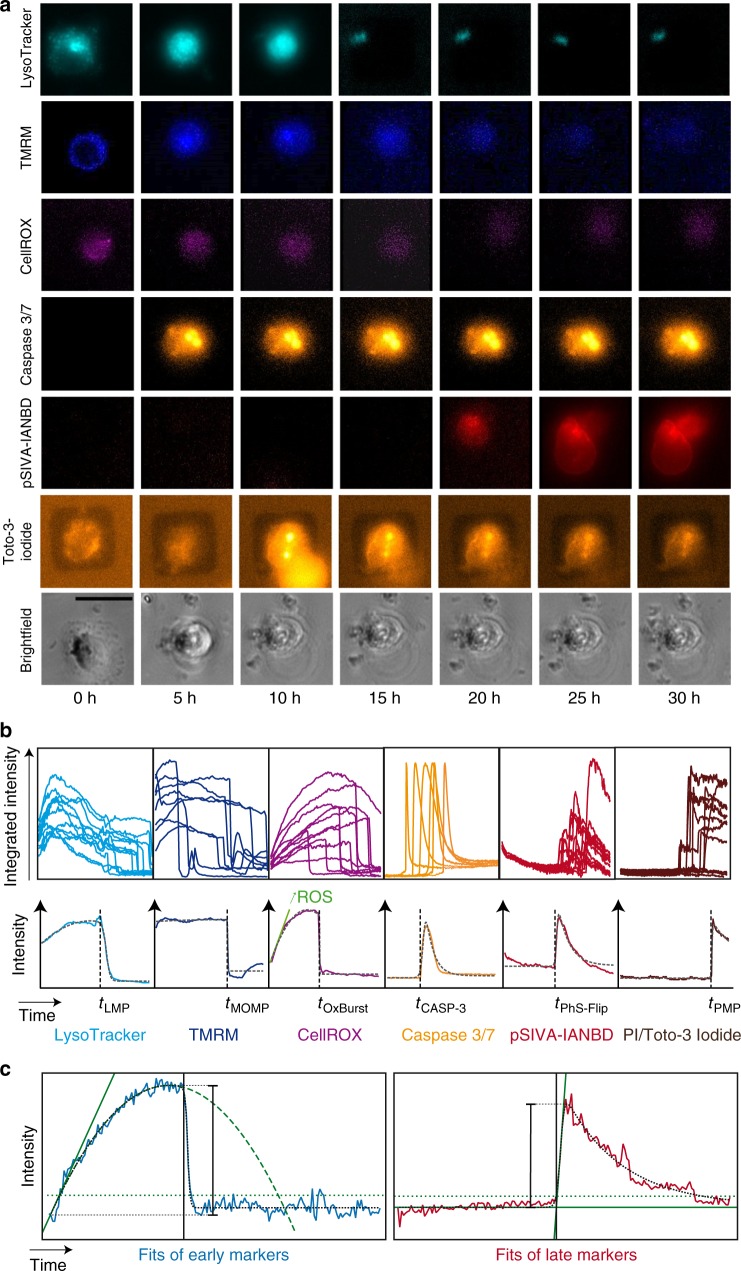
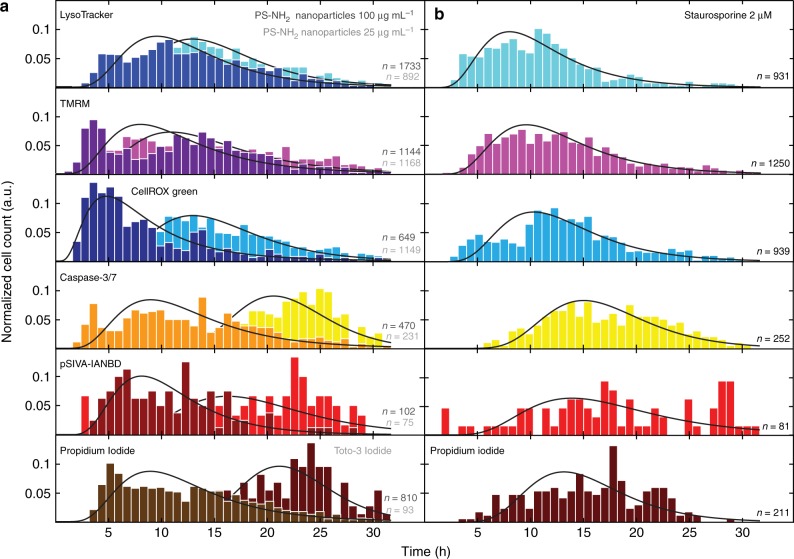
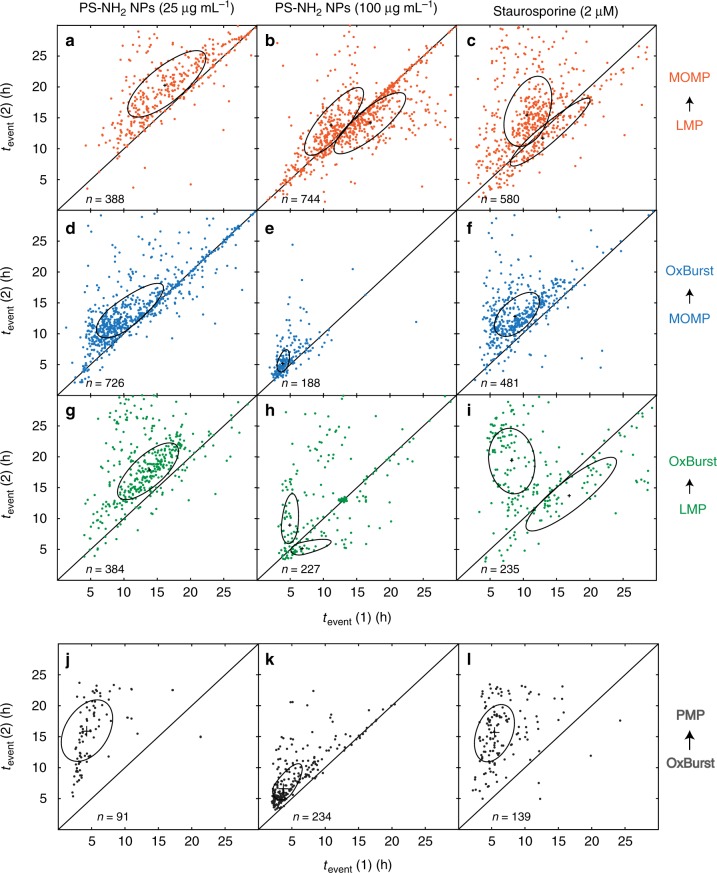
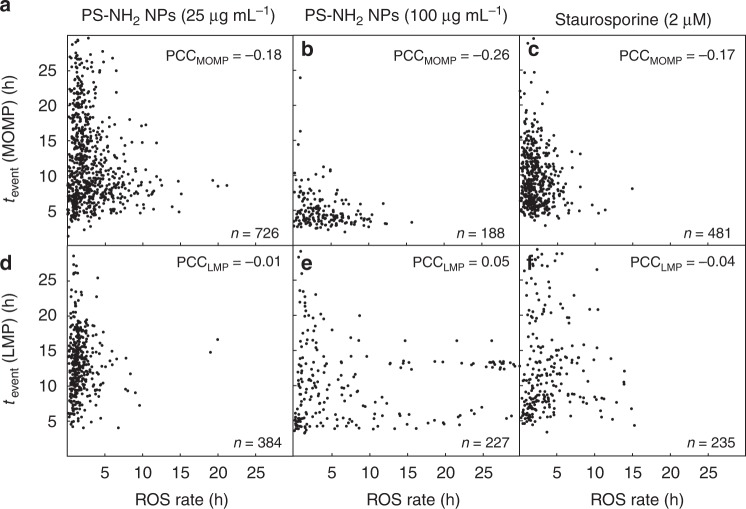
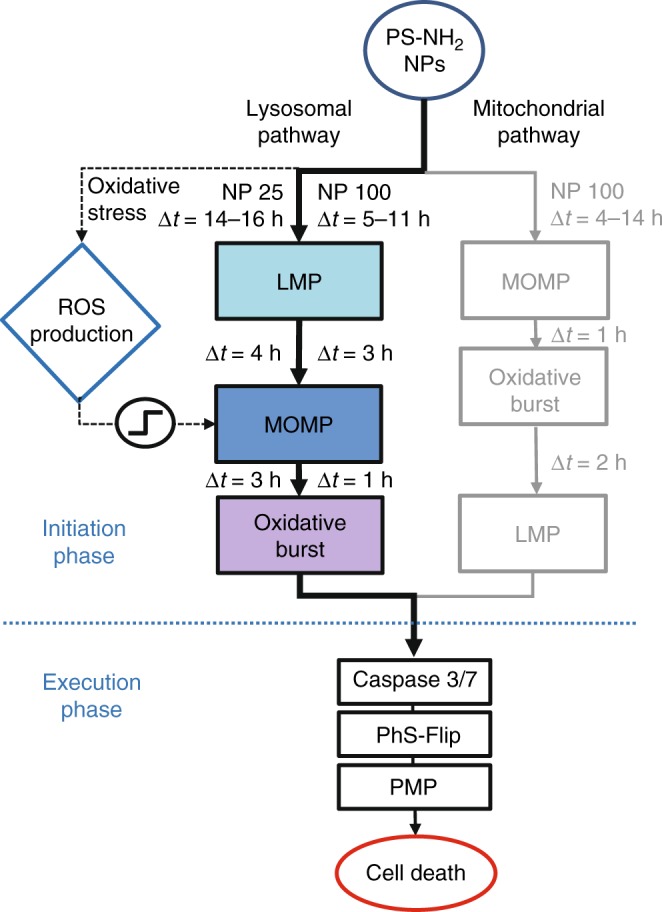
The temporal context of cell death decisions remains generally hidden in ensemble measurements with endpoint readouts. Here, we describe a method to extract event times from fluorescence time traces of cell death-related markers in automated live-cell imaging on single-cell arrays (LISCA) using epithelial A549 lung and Huh7 liver cancer cells as a model system. In pairwise marker combinations, we assess the chronological sequence and delay times of the events lysosomal membrane permeabilization, mitochondrial outer membrane permeabilization and oxidative burst after exposure to 58 nm amino-functionalized polystyrene nanoparticles (PS-NH2 nanoparticles). From two-dimensional event-time scatter plots we infer a lysosomal signal pathway at a low dose of nanoparticles (25 µg mL-1) for both cell lines, while at a higher dose (100 µg mL-1) a mitochondrial pathway coexists in A549 cells, but not in Huh7. In general, event-time correlations provide detailed insights into heterogeneity and interdependencies in signal transmission pathways.


Conflict of interest statement

The authors declare no competing interests.

Figures

Fig. 1
Fig. 1
Nanoparticle-induced cell death studied by high-throughput single-cell time-lapse fluorescence microscopy. a Schematic illustration of the uptake and potential signaling pathways induced by exposure to 58 nm cationic polystyrene nanoparticles (PS-NH2 nanoparticles). Upon interaction with cells, nanoparticles can be directed into one of two interconnected pathways (i.e. LMP-dependent and MOMP-dependent) that trigger the activation of caspases 3/7, which ultimately results in the externalization of phosphatidylserine to the outer leaflet of the plasma membrane (PhS-Flip) and the permeabilization of the plasma membrane (PMP). b Schematic representation of the experimental single-cell platform. Cells are seeded on a micropatterned surface with one cell per square adhesion site (30 × 30 µm), and stained with a panel of fluorescence dyes to monitor key organelles and steps associated with cell death. Views of representative cells stained for mitochondria (blue), lysosomes (cyan), phosphatidylserine (red), nucleus (brown), caspase activation (yellow), and OxBurst (purple) are also shown. Scale bar: 200 µm
Fig. 2
Fig. 2
Image series and time traces of fluorescence markers. a Representative time-lapse images of cells that were exposed to 58 nm 100 µg mL−1 amino-modified polystyrene nanoparticles (PS-NH2 nanoparticles), imaged over 30 h, and stained for lysosomes (LysoTracker, cyan), functional mitochondria (tetramethylrhodamine methyl ester (TMRM), blue), reactive oxygen species (ROS) and oxidative burst (OxBurst; CellROX, purple), activated caspase 3/7 (Caspase 3/7, orange), and flipped phosphatidylserine (pSIVA-IANBD, red). Contrast was adjusted for better visibility. Scale bar: 30 µm. b Representative time traces of each marker in single cells: lysosomes (LysoTracker), MOMP (TMRM), OxBurst (CellROX), caspase 3/7 activation (Caspase 3/7 marker), PhS-Flip (pSIVA-IANBD), and staining of nuclei by propidium iodide (PI) or Toto-3 Iodide. c Exemplary single-cell traces typical for early markers (blue solid line) and late markers (red solid line) with the corresponding noise levels (dotted horizontal green lines). For early markers, the solid green line shows the initial slope, and the vertical black line depicts the breakdown time, which is the time from which on the trace deviates from the parabolic behavior (dashed green line) by more than a threshold. For late markers, the marker onset time (vertical black line) is the time when the onset tangent (diagonal solid green line) crosses the initial fluorescence level (horizontal solid green line)
Fig. 3
Fig. 3
Distributions of the event times and their evolution over a period of 30 h. Normalized event time distributions for events visualized with the indicators LysoTracker, tetramethylrhodamine methyl ester (TMRM), CellROX green, Caspase 3/7, pSIVA-IANBD, and propidium Iodide or Toto-3 Iodide (nuclear DNA/RNA) after exposure to 25 and 100 µg mL−1 amino-modified polystyrene nanoparticles (PS-NH2 nanoparticles) (a) or 2 µM STS (b). Continuous lines indicate approximated log-normal distributions. Each individual plot shows pooled data from up to six individual experiments of cells, which showed both marker signals (n)
Fig. 4
Fig. 4
Pairwise fluorescence marker correlations of single-cell events in A549 cells. Two-dimensional representation of event times tevent (1) and tevent (2) of pairwise markers induced by exposure of cells to 25 µg mL−1 nanoparticles (left), 100 µg mL−1 nanoparticles (middle), or STS (right). The uniaxially asymmetric ellipses display a one-sigma interval around the cluster center. Mitochondrial outer membrane permeabilization (MOMP) was correlated with lysosomal plasma permeabilization (LMP) (a, b, c) as well as with oxidative burst (OxBurst) (d, e, f). Furthermore, LMP and OxBurst were correlated with each other (g, h, i). Cells treated with 25 µg mL−1 nanoparticles show weaker correlations between OxBurst and PMP (j), whereas a stronger correlation is observed for 100 µg mL−1 nanoparticles (k). A weak correlation is shown for staurosporine-exposed cells (l). n is the number of cells shown in the respective scatter plot
Fig. 5
Fig. 5
Rates of reactive oxygen species (ROS) production correlate with mitochondrial outer membrane permeabilization (MOMP), but not with lysosomal membrane permeabilization (LMP). A549 cells were treated with 58 nm amino-modified polystyrene nanoparticles (PS-NH2 nanoparticles) at 25 µg mL−1 (a, d) or 100 µg mL−1 (b, e), or with STS (c, f). The ROS production rates were determined from the linear increase in the CellROX fluorescence and plotted versus the time of outer mitochondrial membrane breakdown (tevent(MOMP)) or lysosomal leakage (tevent(LMP)). An inverse relationship between ROS production rate and MOMP was observed for cells treated with nanoparticles at 25 and 100 µg mL−1 (a, b) as well as for STS (c). In contrast, no correlation was observed between ROS production rate and LMP (df). In the upper right corner, the Pearson correlation coefficient (PCC) is depicted for each plot, respectively. n is the number of cells shown in the respective plot
Fig. 6
Fig. 6
Proposed model for the relationships between lysosomal membrane permeabilization (LMP)-dependent and mitochondrial outer membrane permeabilization (MOMP)-dependent cell death pathways in A549 cells exposed to the lower and the higher doses of 58 nm amino-modified polystyrene nanoparticles (PS-NH2 nanoparticles). In the first case (25 µg mL−1), the internalization of PS-NH2 nanoparticles results in reactive oxygen species (ROS) production and accumulation of nanoparticles in lysosomes, which activates the LMP-dependent cell death pathway. Both LMP and ROS production can contribute to the induction of MOMP. As the last step in the initiation of the LMP-dependent pathway, the release of mitochondrial contents initiates the oxidative burst, which cause ultimately cell death. The application of the higher dose of nanoparticles (100 µg mL−1), in addition to the abovementioned process, the MOMP-dependent pathway can be triggered directly, i.e. independently of LMP and ROS, thus inducing an oxidative burst which is followed by LMP. The LMP- and MOMP-dependent pathways converge in the execution phase to activate caspase 3/7 and the phosphatidylserine flip to the outer membrane, and finally lead to cell death

Similar articles

Cited by

References

    1. Nel A. Toxic potential of materials at the nanolevel. Science. 2006;311:622–627. doi: 10.1126/science.1114397. - DOI - PubMed
    1. Sandin P, Fitzpatrick LW, Simpson JC, Dawson KA. High-speed imaging of rab family small GTpases reveals rare events in nanoparticle trafficking in living cells. ACS Nano. 2012;6:1513–1521. doi: 10.1021/nn204448x. - DOI - PubMed
    1. Wang F, et al. Time resolved study of cell death mechanisms induced by amine-modified polystyrene nanoparticles. Nanoscale. 2013;5:10868–10876. doi: 10.1039/c3nr03249c. - DOI - PubMed
    1. Anguissola, S., Garry, D., Salvati, A., Brien, P. J. O. & Dawson, K. A. High content analysis provides mechanistic insights on the pathways of toxicity induced by amine-modified polystyrene nanoparticles. PLoS One. 9, e108025 (2014). - PMC - PubMed
    1. Ruenraroengsak P, et al. Respiratory epithelial cytotoxicity and membrane damage (holes) caused by amine-modified nanoparticles. Nanotoxicology. 2012;6:94–108. doi: 10.3109/17435390.2011.558643. - DOI - PubMed

Publication types

Substances