. 2019 Jan 28;14(1):e0211041.
doi: 10.1371/journal.pone.0211041. eCollection 2019.

Role of tumor-associated neutrophils in regulation of tumor growth in lung cancer development: A mathematical model

Affiliations

Role of tumor-associated neutrophils in regulation of tumor growth in lung cancer development: A mathematical model

Yangjin Kim et al. PLoS One. .

Abstract

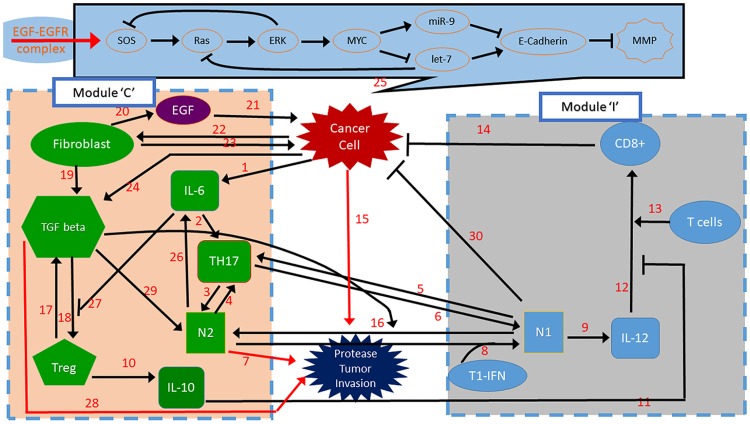
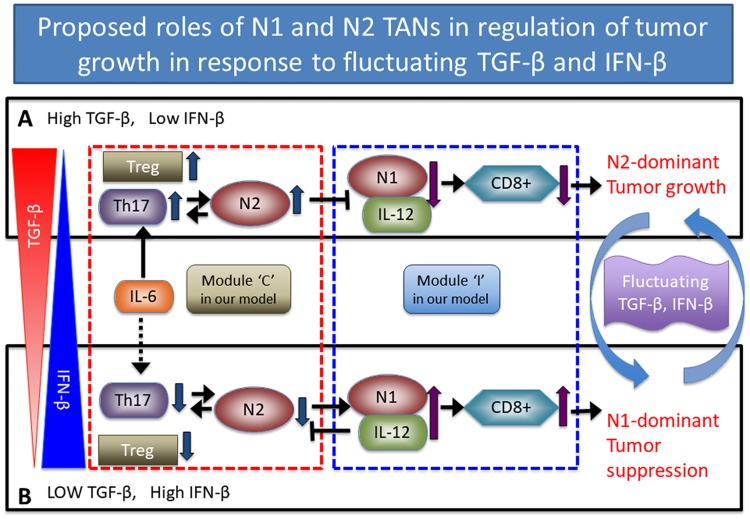
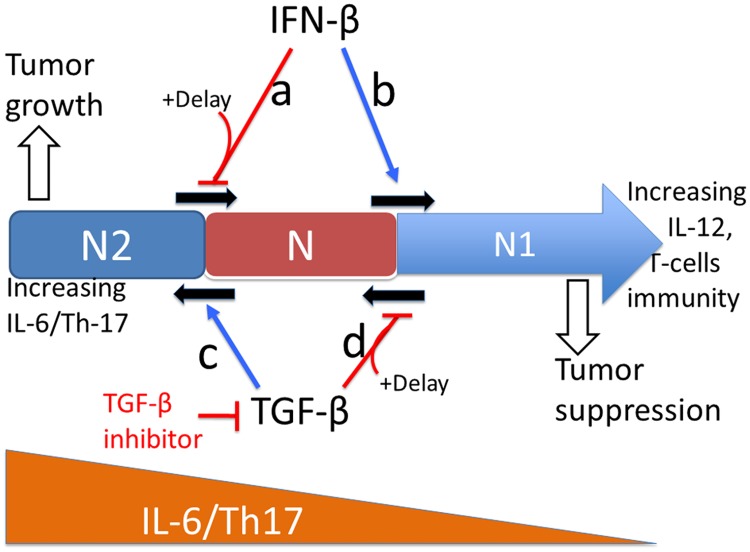
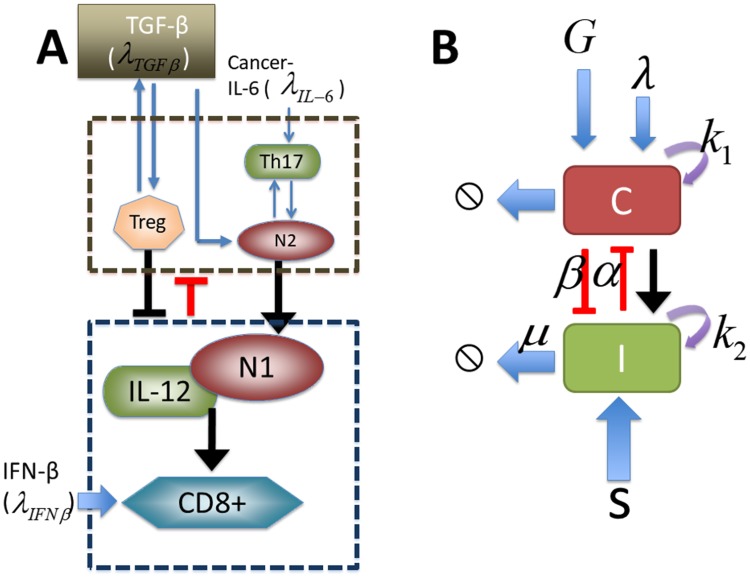
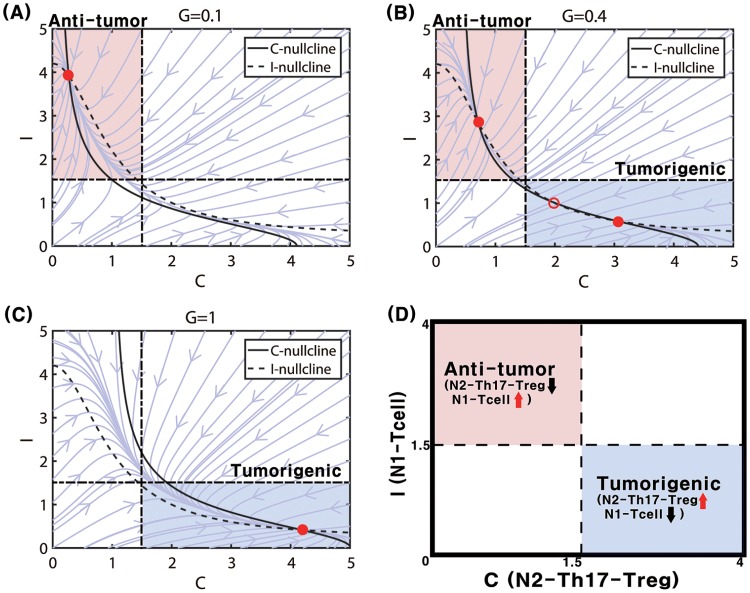
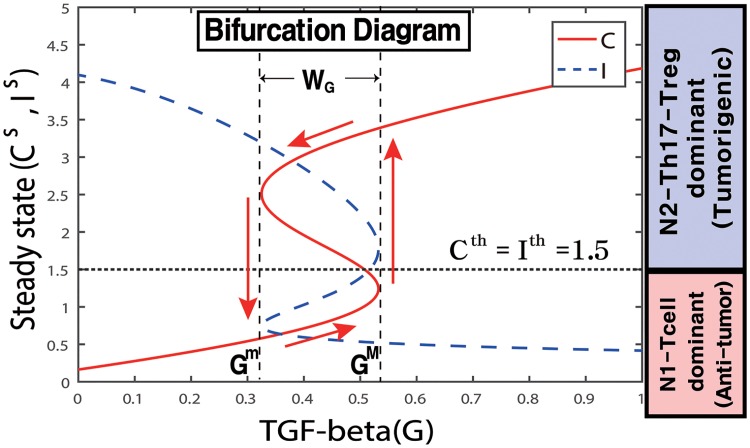
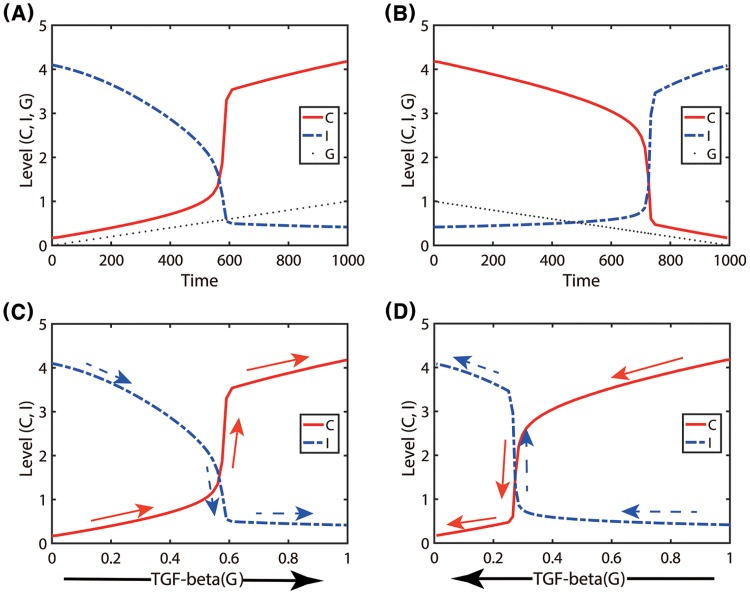
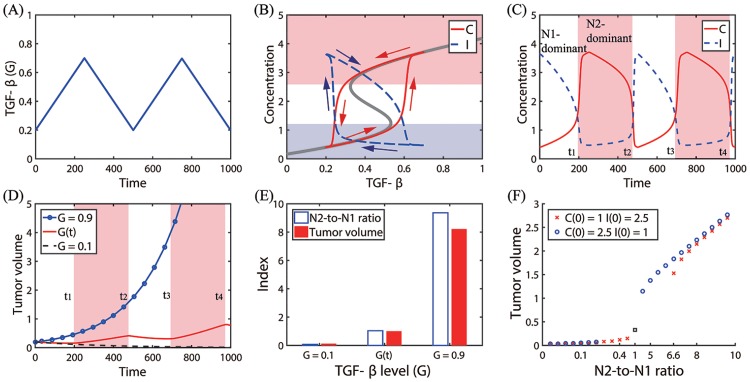
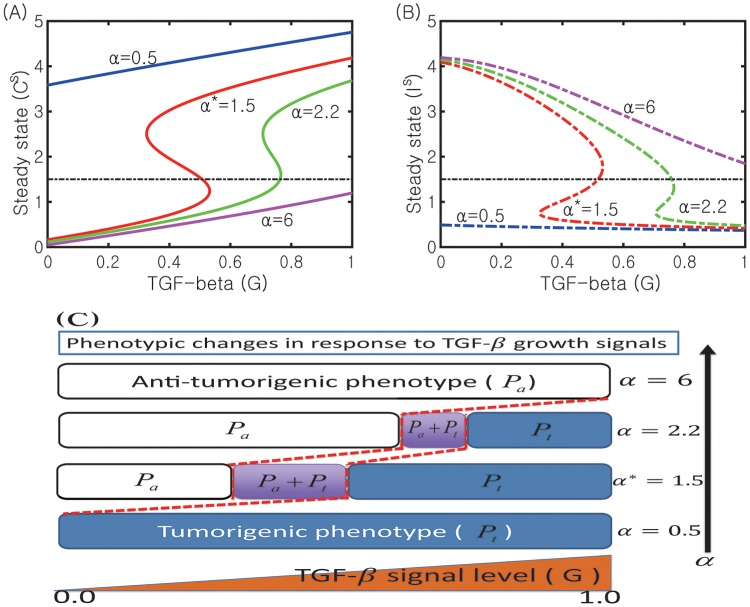
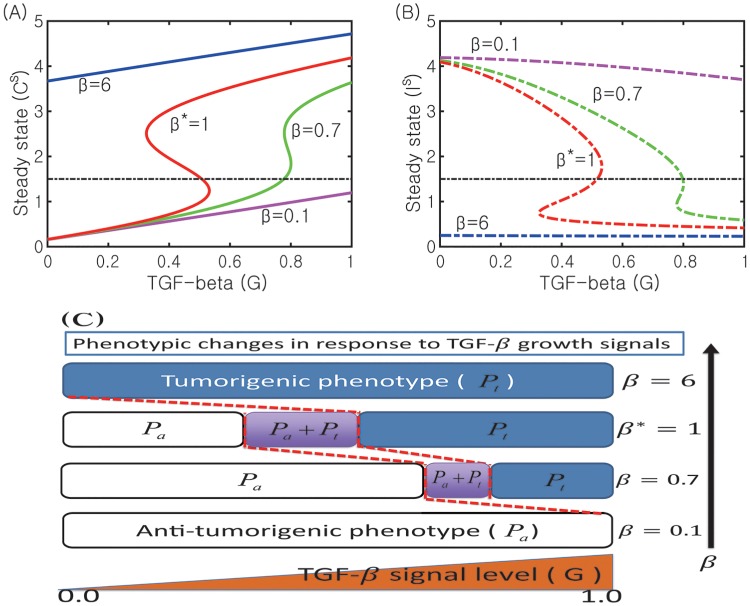
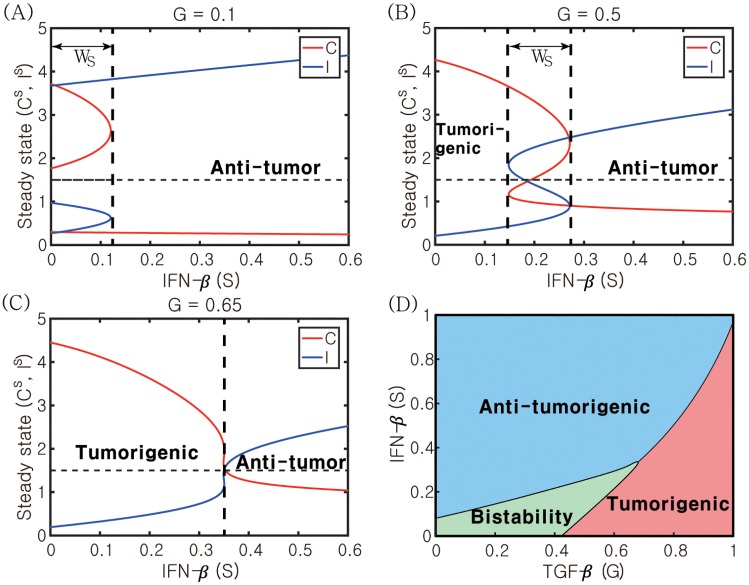
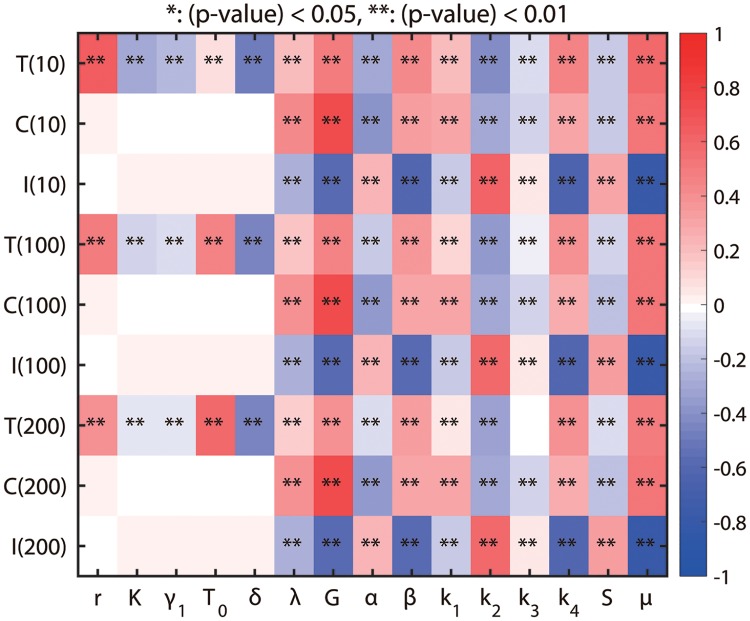
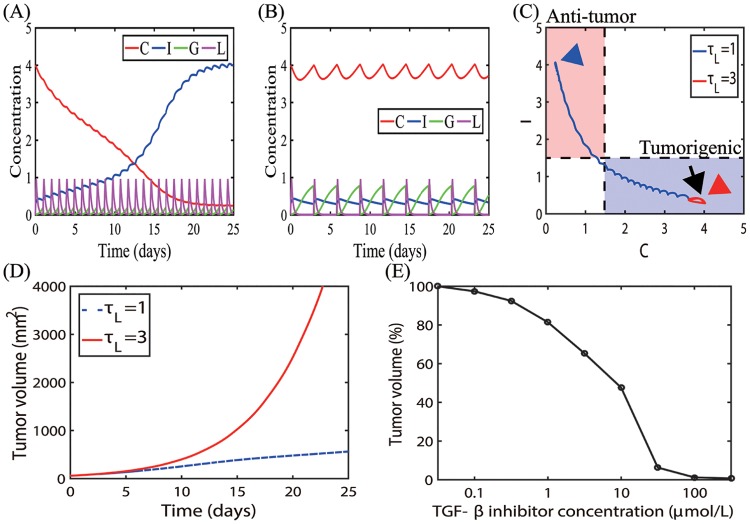
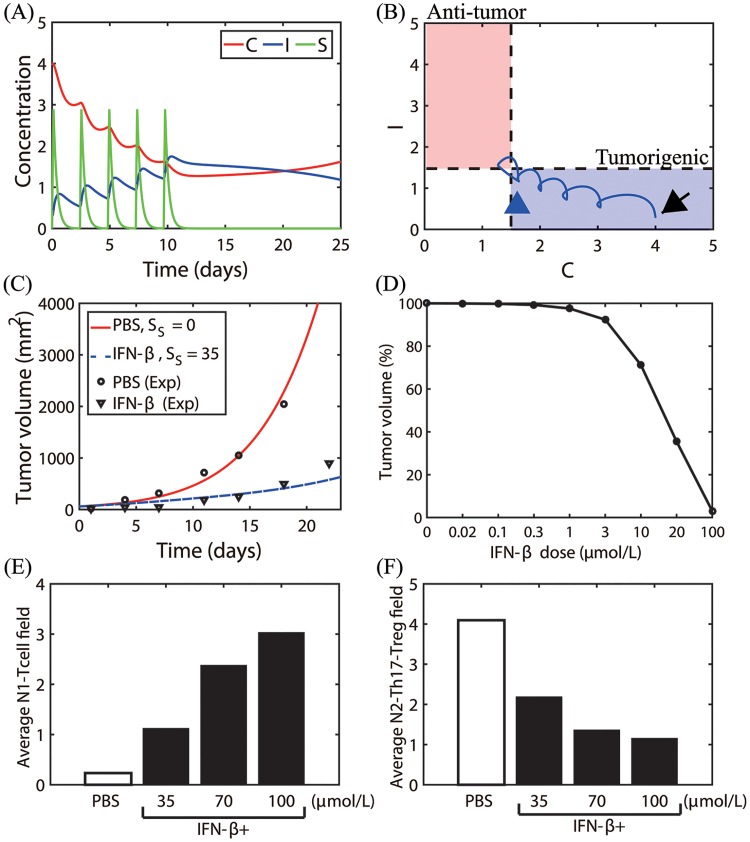
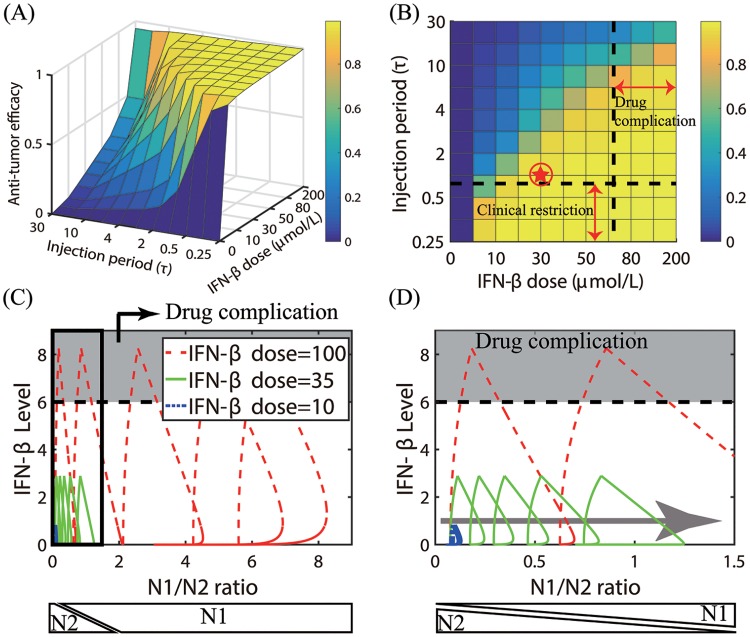
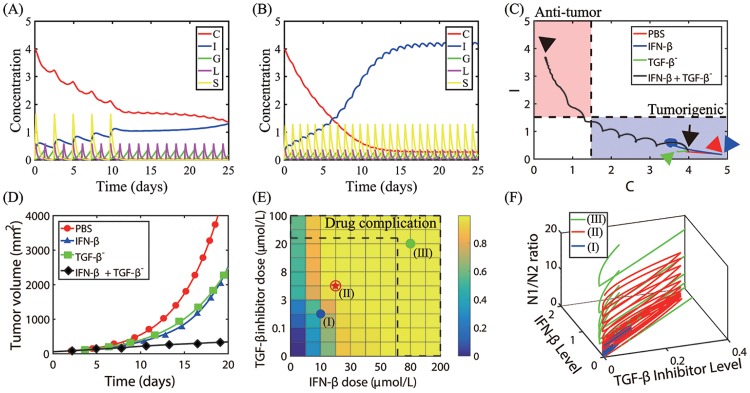
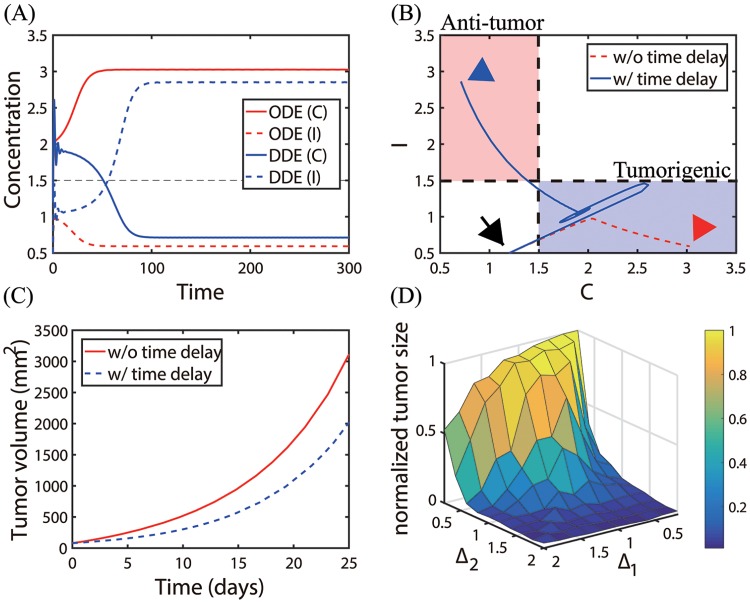
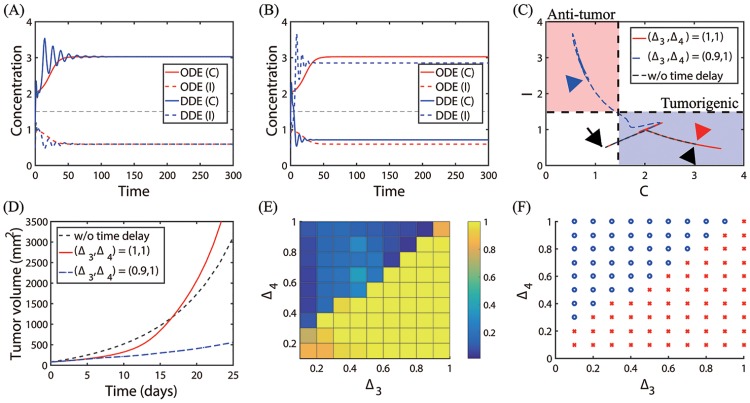
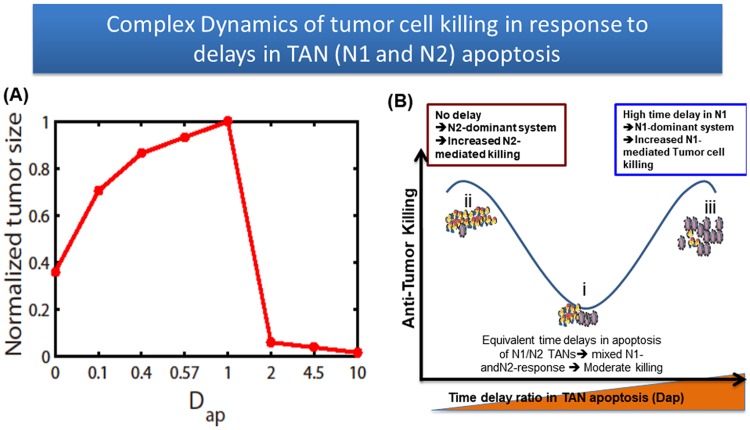
Neutrophils display rapid and potent innate immune responses in various diseases. Tumor-associated neutrophils (TANs) however either induce or overcome immunosuppressive functions of the tumor microenvironment through complex tumor-stroma crosstalk. We developed a mathematical model to address the question of how phenotypic alterations between tumor suppressive N1 TANS, and tumor promoting N2 TANs affect nonlinear tumor growth in a complex tumor microenvironment. The model provides a visual display of the complex behavior of populations of TANs and tumors in response to various TGF-β and IFN-β stimuli. In addition, the effect of anti-tumor drug administration is incorporated in the model in an effort to achieve optimal anti-tumor efficacy. The simulation results from the mathematical model were in good agreement with experimental data. We found that the N2-to-N1 ratio (N21R) index is positively correlated with aggressive tumor growth, suggesting that this may be a good prognostic factor. We also found that the antitumor efficacy increases when the relative ratio (Dap) of delayed apoptotic cell death of N1 and N2 TANs is either very small or relatively large, providing a basis for therapeutically targeting prometastatic N2 TANs.


Conflict of interest statement

The authors have declared that no competing interests exist.

Figures

Fig 1
Fig 1. A schematic of tumor-microenvironment interaction.
(Top) A signaling pathway for lung cancer. (Bottom) Network of interactions between cells involved (cancer cells, fibroblasts, Th17 cells, N1 cells, N2 cells, CD8+ T cells, Tregs) and cytokines and growth factors (EGF, IL-6, IL-10, IL-12, MMPs, TGFβ). By convention, the kinetic interpretation of solid arrows and hammerheads in the interaction network represents induction (arrow) and inhibition (hammerhead), respectively. The module on the left and right will be represented by a module ‘C’ and ‘I’, respectively, in our simplified mathematical model. References for each interaction (number on the arrow or hammerhead) are provided in Table 1.
Fig 2
Fig 2. Proposed role of N1 and N2 complexes in the regulation of tumor growth and immune-suppression in response to fluctuating TGF-β and IFN-β.
The phenotypic balance between N1 and N2 complexes determines tumor growth or suppression in response to TGF-β (red triangle on the left) and IFN-β (blue triangle on the left). (A) High TGF-β levels and low IFN-β activities induce Treg infiltration which in turn leads to biochemical suppression of the overall anti-tumor immune activities of T cells. TGF-β also modifies the tumor microenvironment by transforming N1 into N2 TANs [8, 34] while IFN-β brings the N2 phenotype back to the N1 phenotype [8]. This N2-dominant microenvironment leads to enhanced tumor growth. (B) Low TGF-β levels and upregulation of IFN-β reduce the phenotypical transition from N1 to N2 TANs and leads to upregulation of immune activities of T cells and N1 TANs, leading to suppression of tumor growth. Schematic components of the N2/Th17/Treg complex and the N1/IL12/CD8+ complex are represented by modules ‘C’ (box with the red dotted line) and ‘I’ (box with the blue dotted line) in our theoretical framework. Blue arrows on the right indicate the switching behavior between a tumor-promoting mode in (A) and the tumor-suppressive state in (B) in response to fluctuating TGF-β and IFN-β levels.
Fig 3
Fig 3. Tumor suppressive and tumor promoting roles of TGF-β and IFN-β respectively in the tumor microenvironment.
As the CD8+ cytokines (IL-12) increase, differentiation of N cells transits to the N1 phenotype. There are three ways that IFN-β, TGF-β inhibitor, and delayed apoptotic pathways can keep the system in the safe-guard immune N1 zone. (Cases a, b) Increasing IFN-β levels induces the transition from N2 to N1-zone (case b) [–, –37]. The delayed apoptotic cell death of N2 TANs suppresses entry into the transition phase (case a). (Cases c, d) As the IL-6 level is increased (to the left), the tumor-promoting phenotype, N2, becomes dominant and TGF-β promotes the exit from the transition zone to enter the N2-zone (case c) [35]. The TGF-β inhibitor can reverse the phenotype back to the N1 microenvironment [38]. The delayed apoptotic cell death of N1 TANs suppresses entry into the transition phase (case d).
Fig 4
Fig 4. A schematic of our mathematical model.
Fig 5
Fig 5. Nonlinear dynamics.
Dynamics of the system (5) and (6) in the C-I phase plane in response to low (G = 0.1 in (A)), intermediate (G = 0.4 in (B)), and high (G = 1.0 in (C)) levels of TGF-β-induced transition signals. Steady states marked with circles (stable steady state = filled circle, unstable steady state = empty circle). (D) A schematic of anti-tumorigenic (C < Cth, I > Ith) and tumorigenic (C > Cth, I < Ith) regions in the CI plane. S = 0.2 fixed. Other parameters are given in Table 2.
Fig 6
Fig 6. Bifurcation diagram.
High and low TGF-β signals (G) provide an on-off switch of N2 activation and determine the dichotomous behavior: cancer cell activation and benign status. Y-axis = steady state (SS) of levels of the N2 (C) and N1 (I) complex modules. WG = [Gm, GM] = a window of bi-stabilty. S = 0.2. Other parameters are given in Table 2.
Fig 7
Fig 7. Immune response of TANs to increasing or decreasing TGF-β.
(A, B) Time courses of the N2 (C, red solid curve) and N1 (I, blue dashed curve) levels as the TGF-β level (G; black dotted line) is slowly increased (from 0 to 1.0 in (A)) and slowly decreased (from 1.0 to 0.1 in (B)), respectively. (C, D) Change of C and I as a function of G corresponding to (A, B), respectively. Arrows indicate the moving direction of the solutions. S = 0.2. Other parameters are given in Table 2.
Fig 8
Fig 8. Effect of fluctuating TGF-β on tumor growth.
(A) A time-dependent TGF-β level was assigned for a periodic supply of TGF-β in tumor microenvironment. (B) Trajectories of solutions ((G(t), C(t)) and (G(t), I(t))) in response to TGF-β in (A). The thick gray curve represents the upper and lower branches of steady states (CG hysteresis bifurcation loop in Fig 6). Red and blue arrows = solution flow direction of C and I, respectively. (C) Time courses of concentrations of C and I in response to periodic G input in (A). The N2-dominant Pt-regions were shaded in pink. (D) Time courses of tumor volumes in response to a fixed (G = 0.9 (blue circle); G = 0.1 (dashed)) and fluctuating TGF-β level. Fluctuating TGF-β levels induce transitions between N1- and N2-dominant phenotypes, leading to transient tumor growth at the transition times (t1, t2, t3, t4). (E) The N2-to-N1 ratio and tumor size for three TGF-β conditions in (D). (F) Positive correlations between the tumor volume and the N2-to-N1 ratio with two initial conditions (C(0) = 1, I(0) = 2.5 in red asterisk; C(0) = 2.5, I(0) = 1 in blue circle). Initial conditions in (A-E): C(0) = 0.4, I(0) = 3.6, G(0) = 0.2, T(0) = 0.2. Other parameters are given in Table 2.
Fig 9
Fig 9. Transition to the N1-dominant environment by increasing α.
(A, B) Bifurcation curves GC (Cs in (A)) and GI (Is in (B)) for various N2 inhibition strengths (α = 0.5, 1.5, 2.2, 6.0). (C) The corresponding phenotypic switches between tumorigenic and anti-tumorigenic phases when α is varied. Other parameters are fixed as in Table 2. The base case (α* = 1.5) was marked in star (*).
Fig 10
Fig 10. Effect of the inhibition parameter (β) on the transitions between N1 and N2 system.
(A, B) Bifurcation curves GC (Cs in (A)) and GI (Is in (B)) for for various N1 inhibition strengths (β = 0.1, 0.7, 1.0*, 6.0). (C) The corresponding phenotypic switches between tumorigenic and anti-tumorigenic phases when β is varied. Other parameters are fixed as in Table 2. The base case (β* = 1.0) was marked in star (*).
Fig 11
Fig 11. Dynamic change in response to the IFN-β signal.
(A-C) Activities of N2- and N1-modules in response to IFN-β levels (S) when the TGF-β level is low (G = 0.1 in (A)), intermediate (G = 0.5 in (B)), and high (G = 0.65 in (C)). When the TGF-β level is low or intermediate, there exists a bi-stable window (WS = {S ∈ [0, 1]: SmSSM}) where both Pt and Pa coexist. (D) For a constant IFN-β signaling, the system transits from Pa- to Pt-modes as the TGF-β level is increased. On the other hand, for a fixed TGF-β level, an increase in S induces a transition from Pt-favoring mode to the Pa-status. Other parameters are given in Table 2.
Fig 12
Fig 12. Sensitivity analysis: General Latin Hypercube Sampling (LHS) scheme and partial rank Correlation Coefficient (PRCC) performed on the model.
The colors in each sub box indicates PRCC values of the N2 level and N1 activity for model parameters (r, K, γ1, T0, δ, λ, G, S, k1, k2, k3, k4, α, β, μ) at t = 10, 100, 200. The analysis was carried out using the method of [77] with sample size 10000.
Fig 13
Fig 13. Therapeutic effect of TGF-β inhibitor injection.
(A, B) Time courses of activity levels of the N2 complex (C) and N1 complex (I), and concentrations of TGF-β (G) and TGF-β inhibitor (L) in response to a periodic injection of the TGF-β inhibitor with periods τL = 1 (A) and τL = 3 (B), respectively. (C) Dynamics of the core N1-N2 system in response to the frequent (τL = 1 in (A)) and less frequent (τL = 3 in (B)) injections of the TGF-β inhibitor in the CI plane. (D) Time courses of tumor volume for two different injection protocols in (A, B). (E) Tumor volume (%) at final time (t = 25 days) in response to various TGF-β inhibitor levels (0, 0.02, 0.1, 0.3, 1.0, 3.0, 10, 20, 100 μmol/L). Initial conditions: C(0) = 4.0, I(0) = 0.3, G(0) = 0, L(0) = 0. Initial injection time: t1 = 0. All other parameters are fixed as in Table 2.
Fig 14
Fig 14. Therapeutic effect of IFN-β on tumor growth.
(A) Time courses of the N2 complex level (C), N1 complex activity (I), and concentration of IFN-β (S) in response to a periodic injection of IFN-β on 0, 3, 5, 7, 9 days. (B) Dynamics of the core N1-N2 system corresponding to (A) in the CI plane. Black arrow = initial position, blue arrowhead = terminal point at t = 25 days. (C) Time courses of tumor volume in control (PBS) and IFN-β+ cases: Control (PBS) from the model (red solid line, Ss = 0), IFN-β injection case from the model (blue dashed line, Ss = 35), control (PBS) from experiments (empty circle), IFN-β injection case from experiments (triangle). (D) Tumor volume (%) at final time (t = 25 days) in response to various IFN-β injection levels (Ss = 0, 0.02, 0.1, 0.3, 1.0, 3.0, 10, 20, 100 μmol/L). (E, F) Tumor-infiltrating CD8 T cells and Tregs. Average field of N1-Tcell (E) and N2-Th17-Tregs (F) over the time interval [0–12 days], in the absence (PBS) and presence of IFN-β injections (35,70,100 μmol/L). Initial conditions: C(0) = 4.0, I(0) = 0.3, S(0) = 0. Initial injection time: t1 = 0. Parameters used: G = 0.4. All other parameters are fixed as in Table 2.
Fig 15
Fig 15. Optimal anti-tumor strategies of IFN-β injection.
(A) Anti-tumor efficacy for various dose schedules (τs = 0.25, 0.33, 0.5, 1, 2, 3, 4, 5, 10, 15, 30 days) and injection doses of IFN-β (5, 10, 20, 30, 40, 50, 60, 80, 100, 200 μmol/L). (B) Illustration of anti-tumor efficacy for various schedules in (A) with practical restrictions at a clinic. The optimal dose and schedule are obtained for an intermediate IFN-β dose and an injection schedule without drug complication and under clinical restrictions (100 μmol/L, τs = 1 day; red asterisk). (C) Trajectories of solutions (Γ(t), S(t)) in the IFN-β-Γ plane in response to low (10 μmol/L, blue dashed line), intermediate (35 μmol/L, green solid line), and high (100 μmol/L, red dashed line) doses of IFN-β every day (τs = 1 day). Here, Γ(t)(= I(t)/C(t)) and S(t) are the N1/N2 ratio and IFN-β concentration, respectively, at time t. (D) Enlarged figure from a subpanel (black box on the left) in (C). As the injection strength is increased (10→35→100), the trajectory transits to the N1-dominant system (gray arrow). However, the high dose IFN-β may lead to drug complications or extensive associated toxicity (gray zone on the top) [–86]. N1 and N2 phenotypes on the bottom of panels (C, D) are determined from the N1/N2 ratio.
Fig 16
Fig 16. Therapeutic effect of a combination therapy (TGF-β inhibitor + IFN-β) on tumor growth.
(A) Time courses of the N2 (C) and N1 complex (I) activity, and concentrations of TGF-β (G), TGF-β inhibitor (L), and IFN-β (S) in response to a periodic injection of TGF-β inhibitor every day (τL = 1 day) and IFN-β on 0, 3, 5, 7, 9 days. Ls = 8, Ss = 20. (B) Time courses of all variables (C, I, G, L, S) in response to a periodic injection of both TGF-β inhibitor and IFN-β every day. Ls = 5, Ss = 15. (C) Trajectories of solutions (C(t), I(t)) in response to control (PBS, red) and injections of IFN-β only (blue), TGF-β inhibitor only (TGF-β, green), and combination therapy (IFN-β + TGF-β inhibitor, black). Black arrow = initial position, arrowheads = terminal points at t = 25 day for four cases. Ls = 8, Ss = 20. (D) Time courses of tumor volume corresponding to four cases in (C). The combination therapy leads to synergistic effect on killing tumor cells. (E) Anti-tumor efficacy of the combination therapy with various doses of IFN-β (0, 5, 10, 20, 30, 40, 50, 60, 80, 100, 200) and TGF-β inhibitor (0, 0.02, 0.1, 0.3, 3, 5, 8, 10, 20, 50, 100) at final time (t = 25 days). The optimal dose schedule (marked in red asterisk) is obtained by avoiding drug complications and minimizing dose levels while maintaining the high anti-tumor efficacy. (F) Trajectories of solutions (L(t), S(t), Γ(t)) for the low (blue; (I) in (E)), intermediate (red; (II) in (E)), and high (green; (III) in (E)) doses of both TGF-β inhibitor and IFN-β. Here, Γ(t) = I(t)/C(t) is the N1/N2 ratio. Initial conditions: C(0) = 4.0, I(0) = 0.3, G(0) = 0, L(0) = 0, S(0) = 0. Initial injection time: t1 = 0. All other parameters are fixed as in Table 2.
Fig 17
Fig 17. Dynamics of the system with time delays (Δ1, Δ2) in inhibition of TANs.
(A) Time courses of concentrations of two main variables (C, I) in the absence (ODE, red) and presence (DDE, blue) of time delays (Δ1 = 1.0, Δ2 = 1.2). (B) Trajectories of solutions (C(t), I(t)) in the CI plane corresponding to (A). Time delays can push the Pt-phase to the Pa-phase. (C) Time courses of the tumor volumes corresponding to (A, B). Time delays can slow down the tumor size by the N1 to N2 transition in (B). (D) Normalized tumor sizes for various strengths of the two time delays (Δ1, Δ2). Parameters: S = 0.2, G = 0.4. All other parameters are fixed as in Table 2. Initial condition: T(0) = 0.2, C(0) = 1.2, I(0) = 0.5.
Fig 18
Fig 18. Dynamics of the system with time delays (Δ3, Δ4) in apoptosis of TANs.
(A, B) Time courses of concentrations of two main variables (C, I) in the absence (ODE, red) and presence (DDE, blue) of time delays: Δ3 = 1, Δ4 = 1 in (A); Δ3 = 0.9, Δ4 = 1.0 in (B). (C) Trajectories of solutions (C(t), I(t)) without (black dotted) and with ((Δ3, Δ4) = (1, 1) red solid; (Δ3, Δ4) = (0.9, 1) blue dashed) time delays in (A-B). (D) Time courses of the tumor volumes corresponding to (C). (E) Normalized tumor sizes for various strengths of the two time delays (Δ3 and Δ4). (F) Risk map of the time delay-induced transition of TANs from N2 to N1 phenotypes in the Δ3 − Δ4 plane. Blue circle = switching to the N1-dominant system. Red asterisk = persisting N2-dominant mode. Parameters: S = 0.2, G = 0.4. All other parameters are fixed as in Table 2. Initial condition: T(0) = 0.2, C(0) = 1.2, I(0) = 0.5.
Fig 19
Fig 19. Effect of apoptosis delays of TANs in anti-tumor efficacy.
(A) Tumor volume for various time delay ratios of TAN apoptosis (Dap). (B) A model depicting the impact of Dap on anti-tumor efficacy.

Similar articles

Cited by

References

    1. Torre LA, Bray F, Siegel RL, Ferlay J, Lortet-Tieulent J, Jemal A. Global cancer statistics. CA Cancer J Clin. 2015;65(2):87–108. 10.3322/caac.21262 - DOI - PubMed
    1. Molina JR, Yang P, Cassivi SD, Schild SE, Adjei AA. Non-small cell lung cancer: epidemiology, risk factors, treatment, and survivorship. Mayo Clin Proc. 2008;83(5):584–594. 10.4065/83.5.584 - DOI - PMC - PubMed
    1. Mantovani A, Sozzani S, Locati M, Allavena P, Sica A. Macrophage polarization: tumor-associated macrophages as a paradigm for polarized M2 mononuclear phagocytes. Trends Immunol. 2002;23(11):549–55. 10.1016/S1471-4906(02)02302-5 - DOI - PubMed
    1. Balkwill F, Coussens LM. Cancer: an inflammatory link. Nature. 2004;431(7007):405–6. 10.1038/431405a - DOI - PubMed
    1. Luo Y, Zhou H, Krueger J, Kaplan C, Lee SH, Dolman C, et al. Targeting tumor-associated macrophages as a novel strategy against breast cancer. J Clin Invest. 2006;116(8):2132–2141. 10.1172/JCI27648 - DOI - PMC - PubMed

Publication types

Grants and funding

This work was supported by Konkuk University 2015 Research fund (www.konkuk.ac.kr, Y.J.). The funders had no role in study design, data collection and analysis, decision to publish, or preparation of the manuscript.