. 2019 Feb 7;24(2):271-284.e8.
doi: 10.1016/j.stem.2018.12.012. Epub 2019 Jan 24.

TFAP2C- and p63-Dependent Networks Sequentially Rearrange Chromatin Landscapes to Drive Human Epidermal Lineage Commitment

Affiliations

TFAP2C- and p63-Dependent Networks Sequentially Rearrange Chromatin Landscapes to Drive Human Epidermal Lineage Commitment

Lingjie Li et al. Cell Stem Cell. .

Abstract

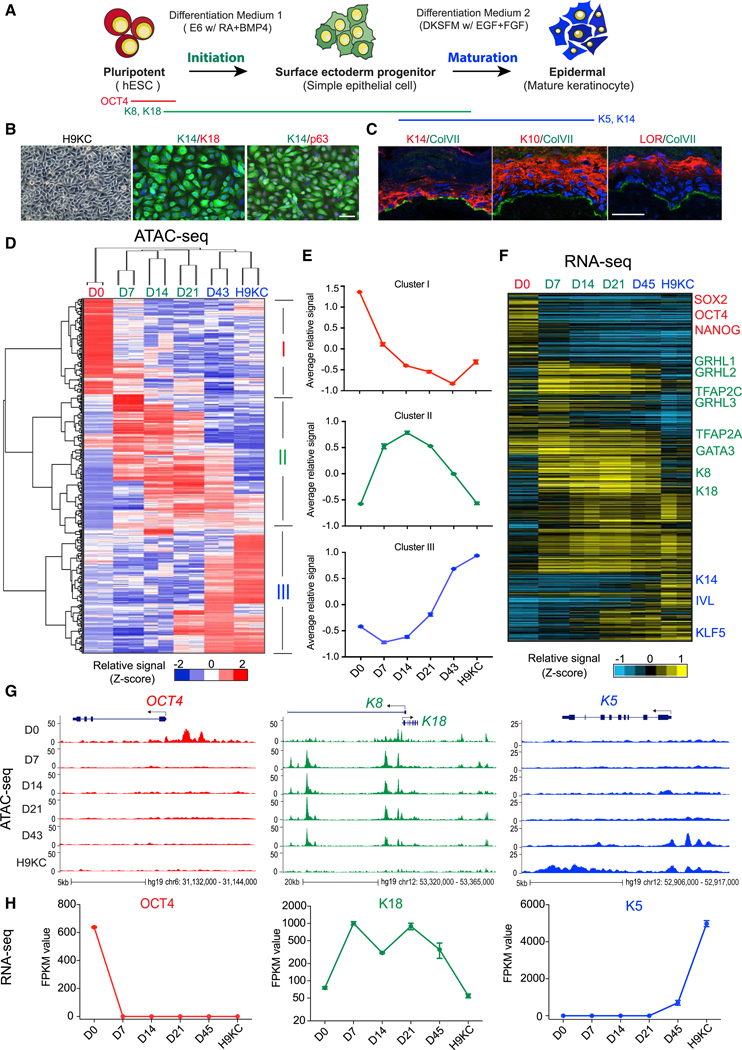
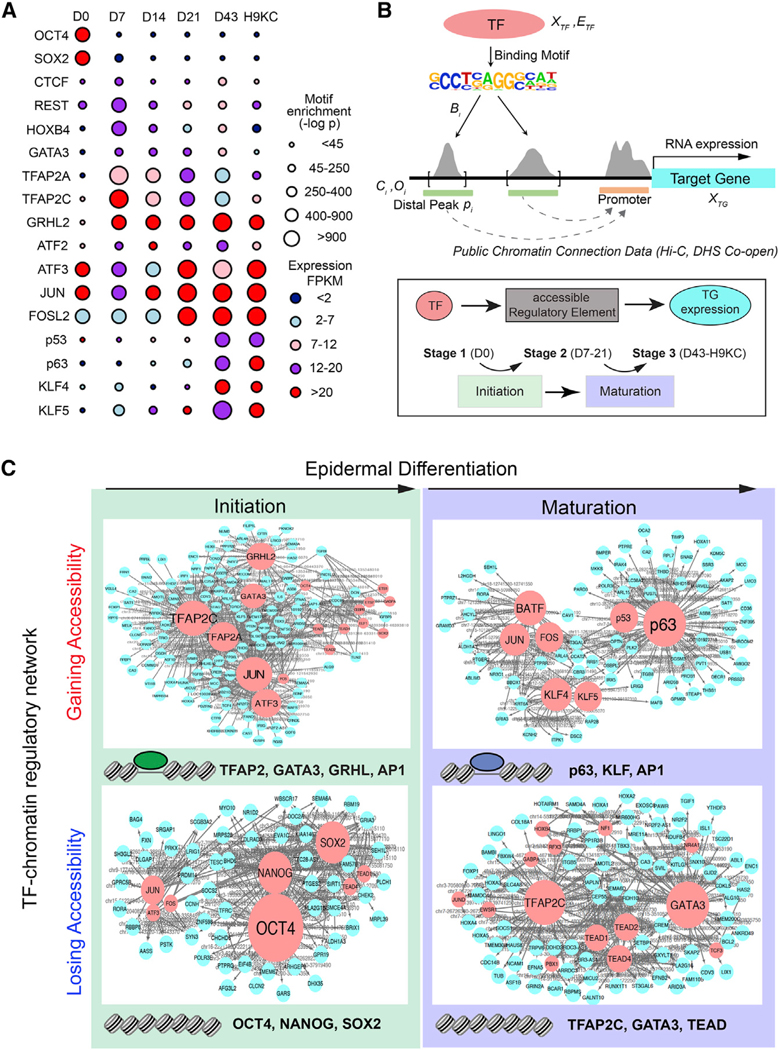
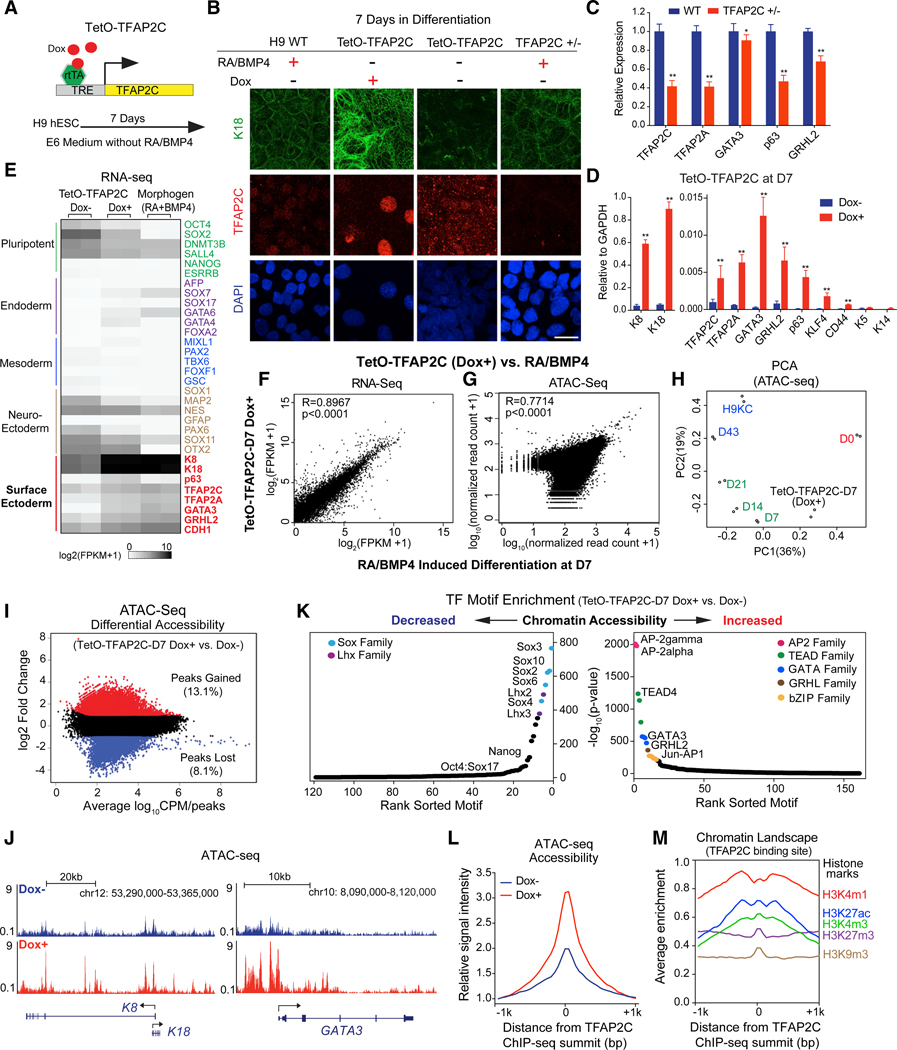
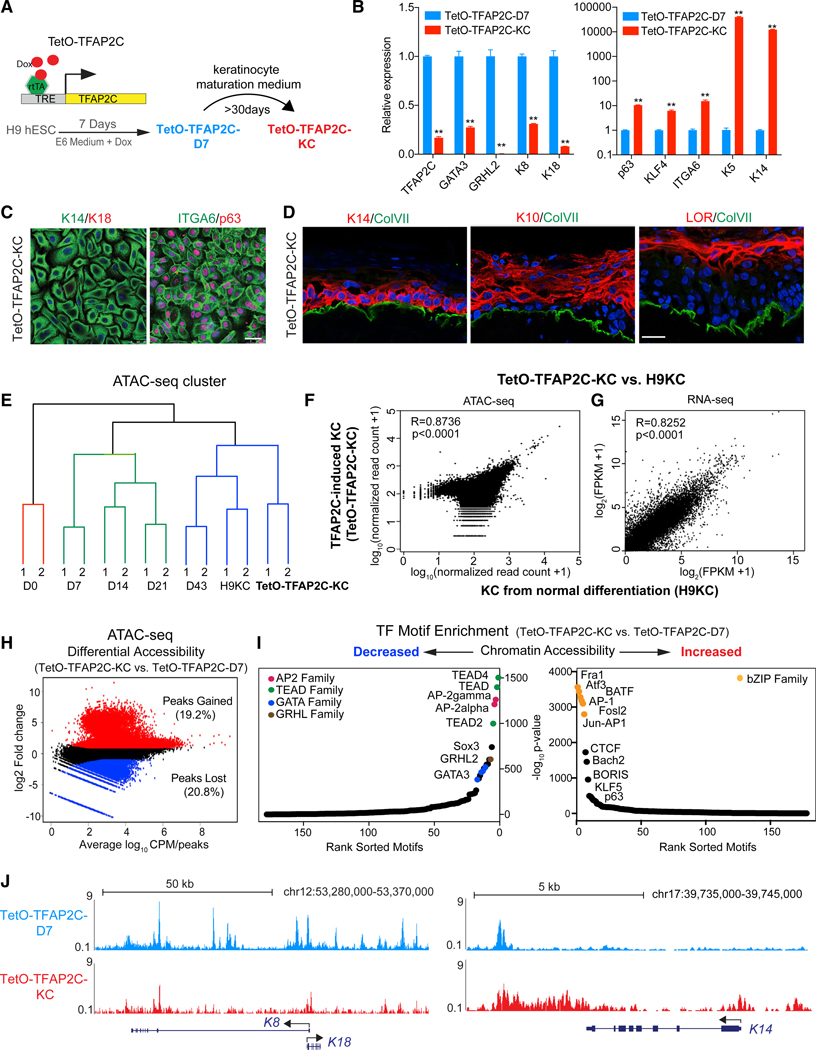
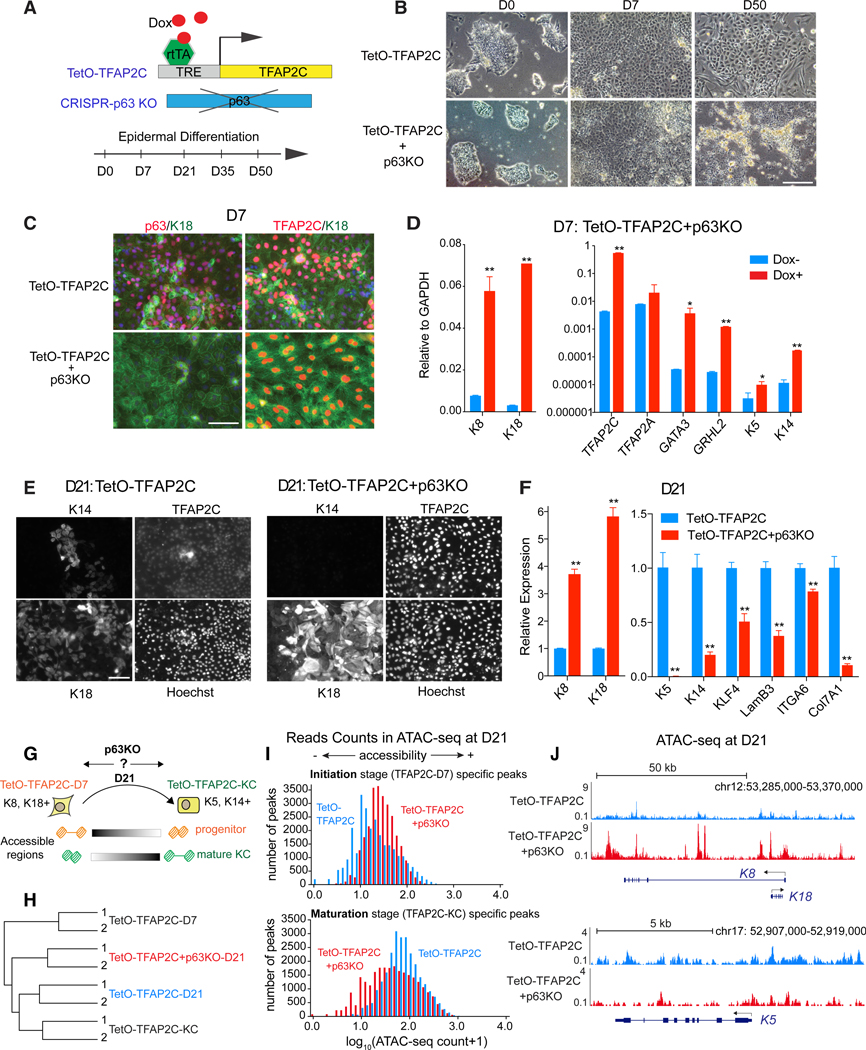
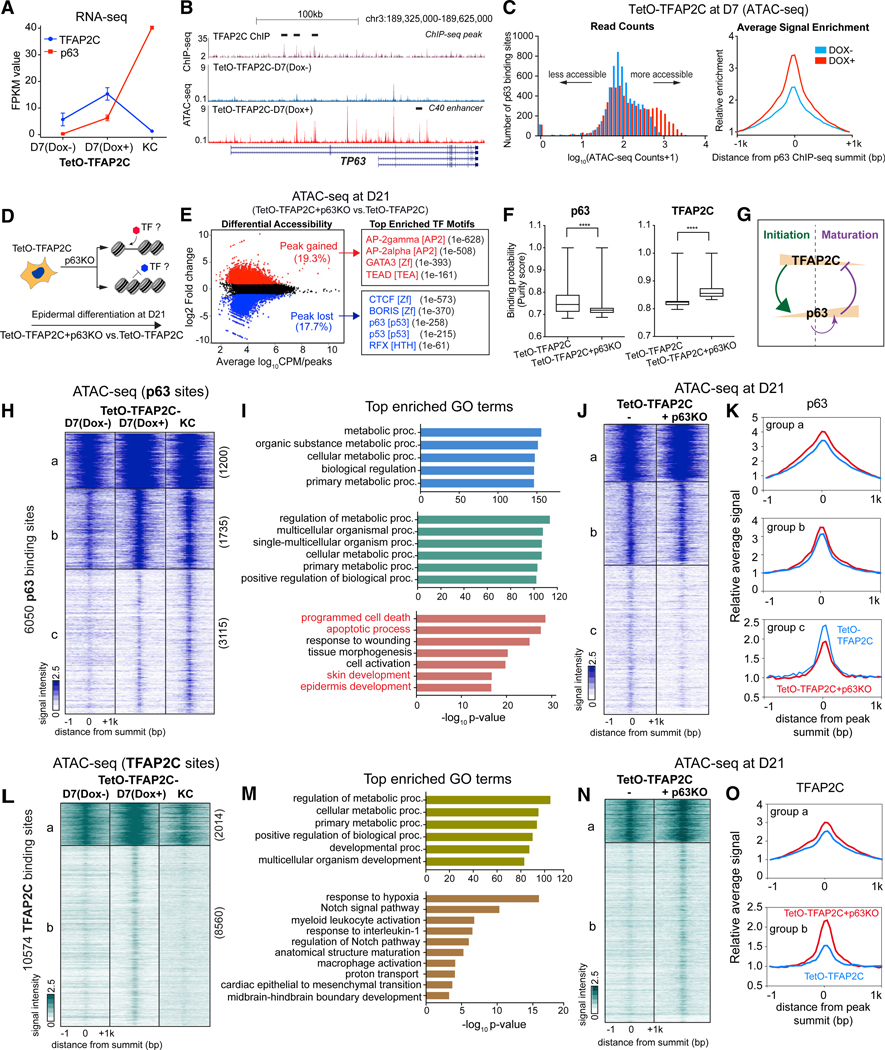
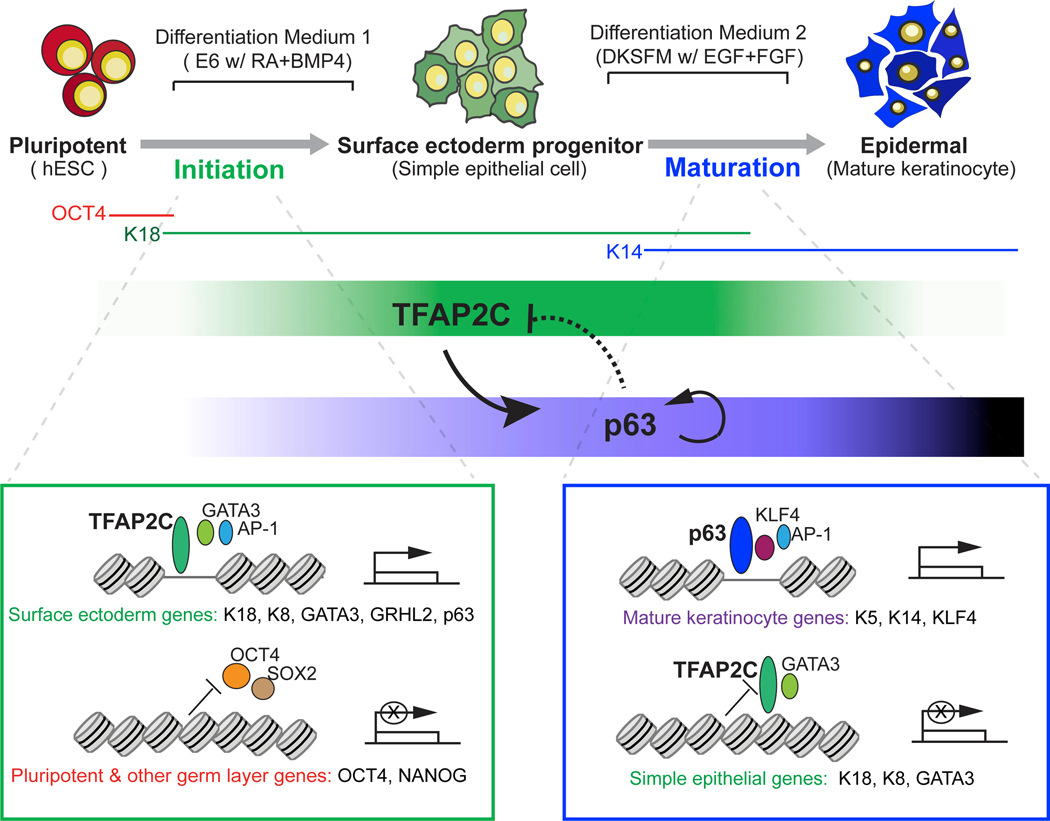
Tissue development results from lineage-specific transcription factors (TFs) programming a dynamic chromatin landscape through progressive cell fate transitions. Here, we define epigenomic landscape during epidermal differentiation of human pluripotent stem cells (PSCs) and create inference networks that integrate gene expression, chromatin accessibility, and TF binding to define regulatory mechanisms during keratinocyte specification. We found two critical chromatin networks during surface ectoderm initiation and keratinocyte maturation, which are driven by TFAP2C and p63, respectively. Consistently, TFAP2C, but not p63, is sufficient to initiate surface ectoderm differentiation, and TFAP2C-initiated progenitor cells are capable of maturing into functional keratinocytes. Mechanistically, TFAP2C primes the surface ectoderm chromatin landscape and induces p63 expression and binding sites, thus allowing maturation factor p63 to positively autoregulate its own expression and close a subset of the TFAP2C-initiated surface ectoderm program. Our work provides a general framework to infer TF networks controlling chromatin transitions that will facilitate future regenerative medicine advances.


Figures

Figure 1.
Figure 1.. Accessible Chromatin and Transcriptome Landscapes Identify Three Major Chromatin Stages during Epidermal Lineage Commitment
(A) Schematic overview of epidermal differentiation from human embryonic stem cells (hESCs). (B) Light image and immunofluorescence (IF) staining of keratinocytes derived from H9 hESCs (H9KC). Scale bar, 50 mm. K14, keratin 14; K18, keratin 18. (C)Reconstruction of stratified epidermis with H9KC in organotypic culture. IF staining shows the maker localization in the organotypic epidermis. The nuclei were stained with DAPI (blue). Scale bar, 25 mm. LOR, loricrin; ColVII, collagen VII. (D)Heatmap of differential open chromatin regulatory elements (REs) characterized from ATAC-seq. Hierarchical clustering yields three clusters of elements and three major groups of samples. The color bar shows the relative ATAC-seq signal (Z score of normalized read counts) as indicated. (E)The trend of signal changes of the three clusters identified from ATAC-seq in (D). (F)Heatmap of expression changes of the genes containing differential ATAC-seq signals at their promoters. The color bar shows the relative expression value (Z score of FPKM [fragments per kilobase of transcript per million mapped reads]) from the RNA-seq. (G) Normalized ATAC-seq profiles at OCT4, K8-K18, and K5 loci, representing the dynamic changes of the three clusters identified in (D) and (E), respectively. (H) Gene expression changes of OCT4, K18, and K5. See also Figures S1 and S2.
Figure 2.
Figure 2.. Identification of Master TFs Driving Surface Ectoderm Initiation and Keratinocyte Maturation by the TF-Chromatin Transcriptional Regulatory Network
(A)TF motifs identified from differential ATAC-seq peaks at each time point. The circle size represents different levels of motif enrichment, and the color represents the expression level of each TF in RNA-seq data. (B)Schematic overview of the method for constructing TF-chromatin transcriptional regulatory network. (Top panel) Connections between TF and target gene (TG) are established through motifs present in open chromatin and publicly available chromatin conformation data. (Bottom panel) The triple elements, i.e., TF-accessible RE (i.e., ATAC-seq peaks)-TG expression, were ranked by the coherence among genomic features and extracted through a statistical model to build the regulatory network. We investigated and ranked their feature changes (Figures S3A–S3C) during two major transition events, initiation and maturation. (C)TF networks identified from the chromatin regions gaining or losing accessibility in the initiation and maturation process. The red and blue nodes represent TF and TG, respectively; the gray edges represent the accessible RE, which was bound by TF to regulate TG expression. Larger size of TF nodes represents more TG connections. Top-ranked TFs are listed at the bottom of each network. Note: TF family name was used to represent several members. See also Figure S3.
Figure 3.
Figure 3.. TFAP2C Initiates the Chromatin Landscape to Induce Surface Ectoderm Differentiation
(A) Schematic representation of the piggyBac TetO-TFAP2C inducible expression system in H9 hESC. TRE, tetracycline-responsive element; rtTA, reverse tetracycline transactivator. (B) IF staining of K18 and TFAP2C in TetO-TFAP2C cells ± Dox and TFAP2C wild-type (WT) and heterozygous (+/−) cells with RA/BMP4 treatment. Scale bar, 20 μm. (C)Gene expression changes in early differentiation upon TFAP2C loss of function. WT and TFAP2C +/− hESCs were induced into surface ectoderm progenitor cells by RA/BMP4 for 7 days. qRT-PCR values were normalized to the values in WT group. (D) Gene expression changes in TetO-TFAP2C cells upon Dox induction. qRT-PCR values were normalized to the values of internal control GAPDH. In (C) and (D),mean ± SD is shown (n = 3; *p < 0.05; **p < 0.01; t test). (E) Heatmap of germ-layer-specific gene expression from the RNA-seq in TetO-TFAP2C cells ± Dox and cells induced by RA/BMP4 for 7 days.(F and G) Scatterplot of gene expression from RNA-seq (F) and of read counts from ATAC-seq (G) in early differentiated cells by TFAP2C activation (TetO-TFAP2C Dox+) versus by RA/BMP4 induction at D7 with Pearson correlation (R) value displayed. (H) Principal-component analysis (PCA) of ATAC-seq data from TetO-TFAP2C-D7 (Dox+) and samples at all time points during normal differentiation. (I) Scatterplot of differential accessibility in TetO-TFAP2C-D7 Dox+ versus Dox cells. The values of log2 fold change > 1 or <−1 are labeled as “peaks gained” or “peaks lost” with respective percentage and color. CPM, count per million reads. (J) ATAC-seq tracks show increased chromatin accessibility at K8-K18 and GATA3 loci upon TFAP2C-induced early differentiation (Dox+ versus Dox−). (K) TF motif enrichment in the regions with decreased (left) or increased (right) chromatin accessibility in TetO-TFAP2C-D7 Dox+ versus Dox− cells. TF motifs from one family are labeled in the same color and are indicated in the top corners. (L) Average enrichment of ATAC-seq chromatin accessibility within −1/+1 kb from TFAP2C binding sites in cells ± Dox induction. (M) Average enrichment of histone marks within −1/+1 kb from TFAP2C binding sites in TFAP2C overexpressed cells. See also Figure S4
Figure 4.
Figure 4.. TFAP2C-Induced Surface Ectoderm Progenitors Are Competent to Produce Functional Keratinocytes in Maturation Medium
(A) Schematic diagram shows the experimental procedure to study whether TFAP2C-induced surface ectoderm progenitor cells (TetO-TFAP2C-D7) can further differentiate into functional keratinocytes (TetO-TFAP2C-KC) in maturation medium. (B) Gene expression changes in late differentiation by comparing TetO-TFAP2C-KC versus TetO-TFAP2C-D7. qRT-PCR values were normalized to the values inTetO-TFAP2C-D7. Mean ± SD is shown (n = 3; **p < 0.01; t test). (C) IF staining of selected markers in TFAP2C-induced keratinocytes. Scale bar, 25 μm. (D) Reconstruction of stratified epidermis with TFAP2C-induced keratinocytes. IF staining of selected markers is shown. Scale bar, 25 μm. (E) Hierarchical clustering of TetO-TFAP2C-KC and samples from normal differentiation using chromatin accessibility similarities from ATAC-seq analysis. Color denotes the three major clusters. (F and G) Scatterplot of read counts from ATAC-seq (F) and of gene expression from RNA-seq (G) in TFAP2C-induced keratinocytes versus keratinocytes from normal differentiation with Pearson correlation (R) value displayed, respectively. (H) Scatterplot of differential accessibility in TetO-TFAP2C-KC versus TetO-TFAP2C-D7 cells. (I) TF motif enrichment in the regions with decreased (left) or increased (right) chromatin accessibility in TetO-TFAP2C-KC versus TetO-TFAP2C-D7. TF motifsfrom one family are labeled with the same color and are indicated in the top corner. (J) ATAC-seq tracks show decreased chromatin accessibility at K8-K18 locus and increased accessibility at K14 locus in TFAP2C-induced mature keratinocytes (TetO-TFAP2C-KC) versus early progenitor cells (TetO-TFAP2C-D7). See also Figure S5
Figure 5.
Figure 5.. p63 Is Necessary for Keratinocyte Maturation during TFAP2C-Induced Epidermal Differentiation
(A) Schematic illustration of the approach to functionally study p63 via CRISPR/Cas9-mediated gene knockout (KO) during TFAP2C-induced epidermal differentiation. (B) Morphological changes in TFAP2C-induced epidermal differentiation upon p63 deletion. Scale bar, 200 μm. (C and D) p63 loss of function does not affect surface ectoderm initiation at early differentiation. (C) IF staining of the cells at D7. Scale bar, 50 mm. (D) qRT-PCR shows increased expression of surface ectoderm markers in TetO-TFAP2C+p63KO cells upon Dox induction. qRT-PCR values were normalized tothe values of internal control GAPDH. (E and F) p63 loss of function results in failure of keratinocyte maturation at late stage of differentiation. (E) IF staining of the cells with genotypes labeled as TetO-TFAP2C (left) and TetO-TFAP2C+p63KO (right) at D21. Nuclei were stained by Hoechst. Scale bar, 40 μm. (F) qRT-PCR shows higher expression level of surface ectoderm markers and lower level of mature keratinocyte markers upon p63 KO at D21. qRT-PCR values were normalized to the values from control cells (TetO-TFAP2C). In (D) and (F), mean ± SD is shown (n = 3; *p < 0.05; **p < 0.01; t test). (G) Schematic illustration of the analysis of chromatin changes upon p63 KO at D21. The TetO-TFAP2C-D7(K8 and K18+)- and TetO-TFAP2C-KC(K5 and K14+)-specific accessible regions were utilized as the representative features of “progenitor” and “mature KC,” respectively, to evaluate the differentiation status of the cells at D21 with and without p63 (i.e., TetO-TFAP2C versus TetO-TFAP2C+p63KO). (H) Hierarchical clustering of the ATAC-seq signals shows a close relationship between TetO-TFAP2C-D21 and TetO-TFAP2C-KC, and loss of p63 arrests cells at a more immature stage between TetO-TFAP2C-D7 and TetO-TFAP2C-KC. (I) Loss of p63 results in a higher level of chromatin accessibility at initiation-stage-specific peaks and a lower level of accessibility at maturation-stage-specific peaks. Histogram shows ATAC-seq read counts distribution from the above two peak regions in TetO-TFAP2C versus TetO-TFAP2C+p63KO at D21. (J) Genome browser tracks comparing ATAC-seq signal in TetO-TFAP2C versus TetO-TFAP2C+p63KO at K8-K18 and K5 loci. See also Figure S6
Figure 6.
Figure 6.. Feedback Regulation between p63 and TFAP2C Drives Chromatin Transition from Progenitor to Mature Keratinocytes
(A) Gene expression changes of TFAP2C and p63 during TFAP2C-induced epidermal differentiation. (B) Genome browser tracks show ATAC-seq signal in TetO-TFAP2C cells ± Dox induction, relative to TFAP2C ChIP-seq (black bar highlights the peak region) fromD7 Dox-induced differentiation at TP63 locus. Note: two isoform types (full-length and deltaN-p63) are schematically shown. There are multiple regions gaining accessibility signal at TP63 locus upon Dox induction, including the p63 self-activation enhancer: C40 enhancer (black bar annotated). (C) p63 binding sites become more accessible in TFAP2C-induced surface ectoderm progenitor cells. Histograms of read counts distribution (left) and average signal enrichment (right) of ATAC-seq in p63-bound regions in cells with and without TFAP2C induction are shown. (D) Schematic illustration of identification of TF motifs associated with chromatin accessibility changes upon p63 loss of function. (E) (Left) Scatterplot of differential accessibility in TetO-TFAP2C+p63KO versus TetO-TFAP2C at D21. (Right) Top enriched TF motifs identified from differential accessible regions are shown. TF motif name, TF family, and p values are presented. (F) PIQ footprinting analysis indicates a lower likelihood of TF occupancy of p63 and a higher likelihood of TFAP2C in p63 KO cells (TetO-TFAP2C+p63KO). Significant difference with ****p < 0.0001 relative to control (TetO-TFAP2C) was determined by t test. (G) A model diagram shows TFAP2C/p63 negative feedback regulation and p63 self-activation during epidermal lineage commitment. (H) Heatmap shows chromatin accessibility changes within p63-bound regions during TFAP2C-induced epidermal differentiation. K-means clustering identifies three groups of changes (labeled as “a, b, and c” with respective numbers). (I) Top enriched GO terms identified from the three clusters shown in (H). (J and K) Comparison of ATAC-seq signal between TetO-TFAP2C+p63KO versus TetO-TFAP2C in the three groups of p63 binding sites. The heatmap (J) and average enrichment (K) of signal are shown. (L) Heatmap shows chromatin accessibility changes within TFAP2C-bound regions during TFAP2C-induced epidermal differentiation. K-means clustering identifies two groups of chromatin changes (labeled as a and b with respective numbers). (M) Top enriched GO terms identified from the two clusters in (L). (N) Comparison of ATAC-seq signal changes between TetO-TFAP2+p63KO versus TetO-TFAP2C in the two groups of TFAP2C binding sites. The heatmap (N) and average enrichment (O) of signal are shown. See also Figure S7
Figure 7.
Figure 7.. A Model of Epigenomic Regulation during Epidermal Lineage Commitment
A proposed model depicts the identified chromatin states and feedback regulation between TFAP2C- and p63-centered TF regulatory networks driving the chromatin transition during epidermal lineage commitment.

Similar articles

Cited by

References

    1. Antonini D, Sirico A, Aberdam E, Ambrosio R, Campanile C, Fagoonee S, Altruda F, Aberdam D, Brissette JL, and Missero C. (2015). A composite enhancer regulates p63 gene expression in epidermal morphogenesis and in keratinocyte differentiation by multiple mechanisms. Nucleic Acids Res. 43, 862–874. - PMC - PubMed
    1. Auman HJ, Nottoli T, Lakiza O, Winger Q, Donaldson S, and Williams T. (2002). Transcription factor AP-2gamma is essential in the extra-embryonic lineages for early postimplantation development. Development 129, 2733–2747. - PubMed
    1. Bragança J, Eloranta JJ, Bamforth SD, Ibbitt JC, Hurst HC, and Bhattacharya S. (2003). Physical and functional interactions among AP-2 transcription factors, p300/CREB-binding protein, and CITED2. J. Biol. Chem. 278, 16021–16029. - PubMed
    1. Buenrostro JD, Giresi PG, Zaba LC, Chang HY, and Greenleaf WJ (2013). Transposition of native chromatin for fast and sensitive epigenomic profiling of open chromatin, DNA-binding proteins and nucleosome position. Nat. Methods 10, 1213–1218. - PMC - PubMed
    1. Calo E, Flynn RA, Martin L, Spitale RC, Chang HY, and Wysocka J. (2015). RNA helicase DDX21 coordinates transcription and ribosomal RNA processing. Nature 518, 249–253. - PMC - PubMed

Publication types