. 2019 Mar 1;121(3):1018-1033.
doi: 10.1152/jn.00677.2018. Epub 2019 Jan 23.

Cochlear compound action potentials from high-level tone bursts originate from wide cochlear regions that are offset toward the most sensitive cochlear region

Affiliations

Cochlear compound action potentials from high-level tone bursts originate from wide cochlear regions that are offset toward the most sensitive cochlear region

C Lee et al. J Neurophysiol. .

Abstract

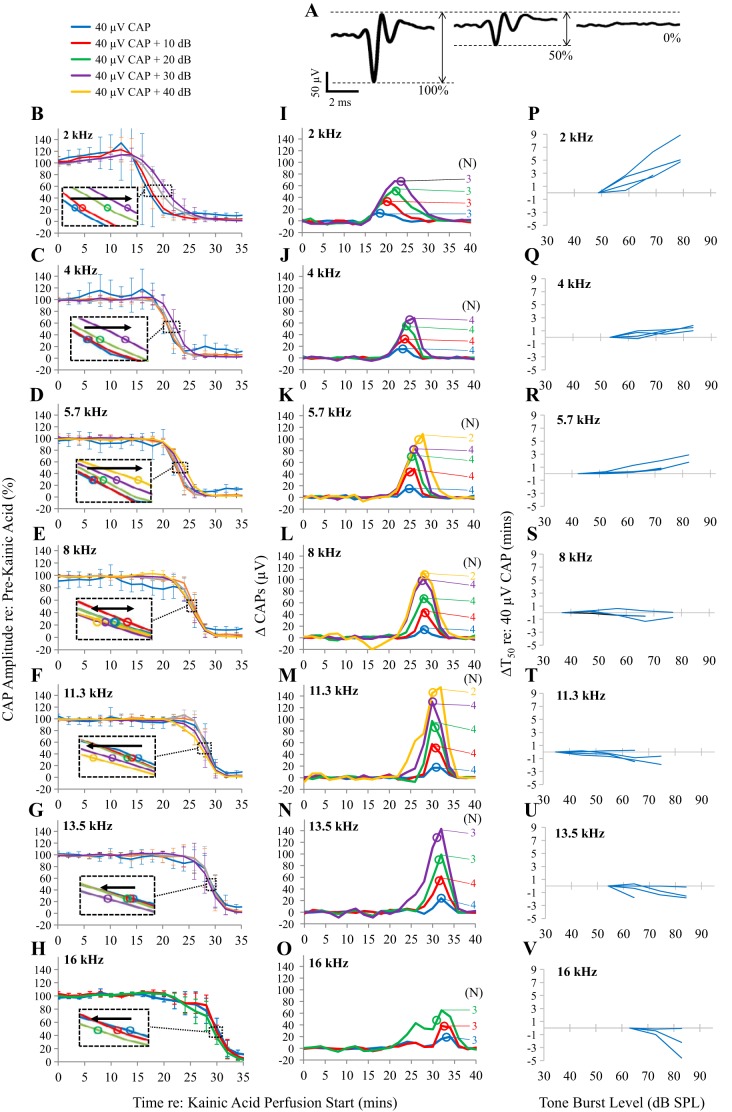
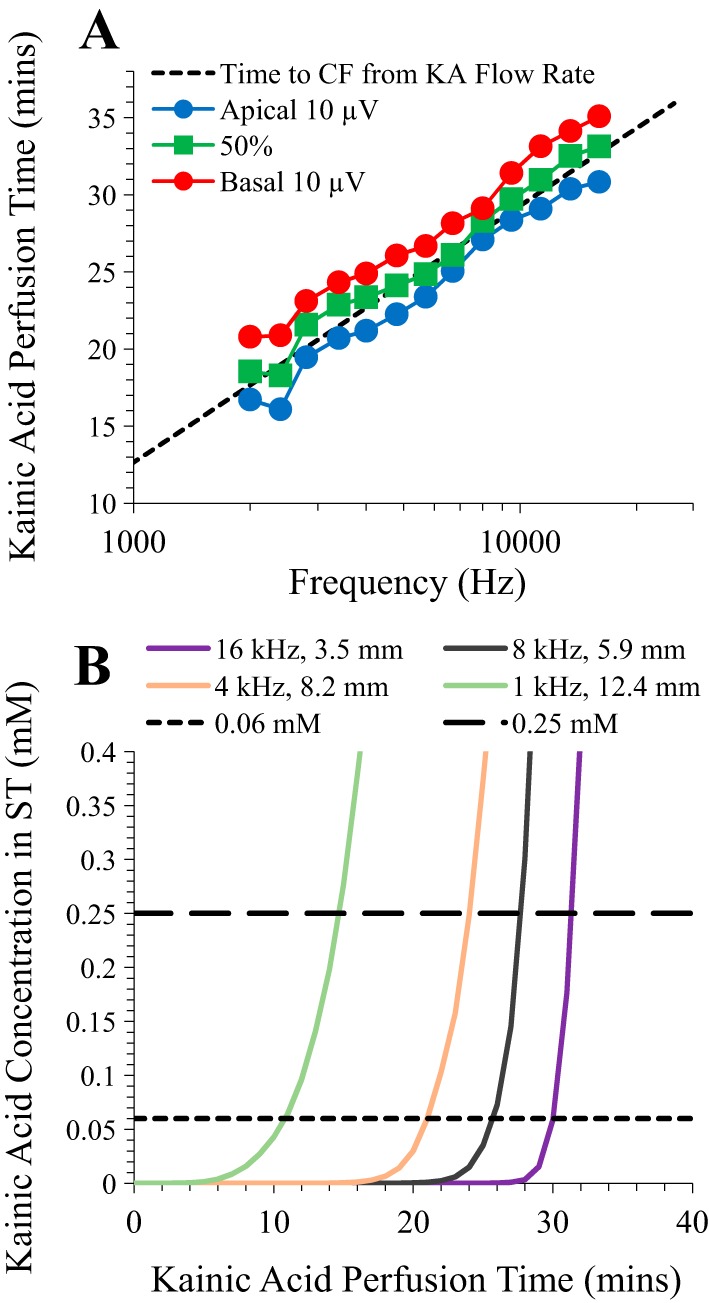
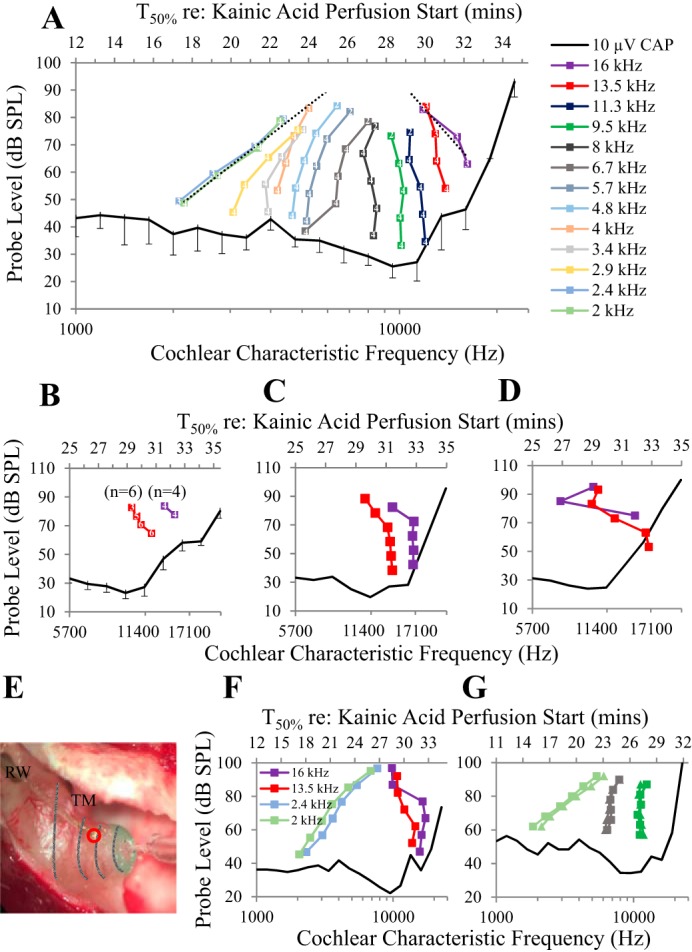
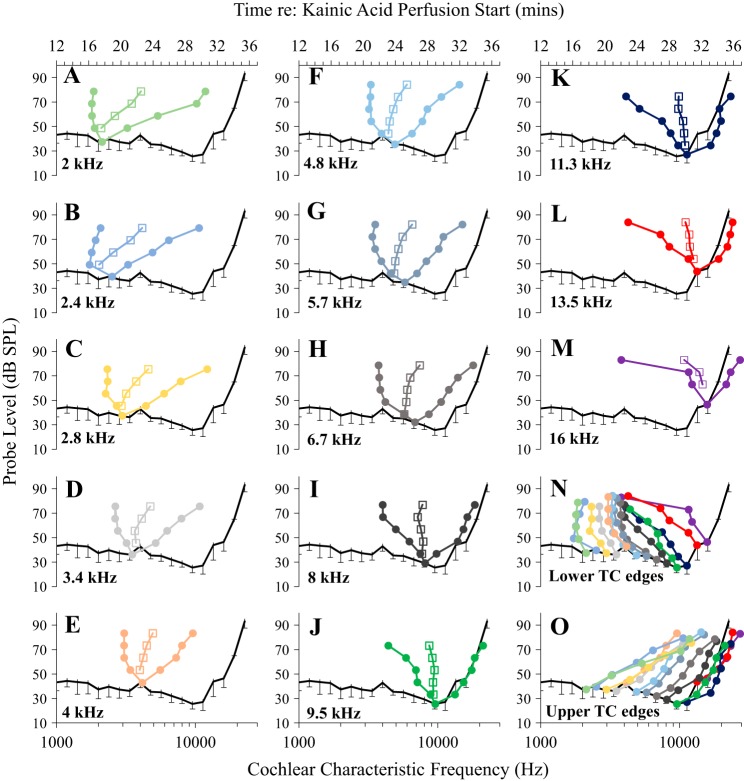
Little is known about the spatial origins of auditory nerve (AN) compound action potentials (CAPs) evoked by moderate to intense sounds. We studied the spatial origins of AN CAPs evoked by 2- to 16-kHz tone bursts at several sound levels by slowly injecting kainic acid solution into the cochlear apex of anesthetized guinea pigs. As the solution flowed from apex to base, it sequentially reduced CAP responses from low- to high-frequency cochlear regions. The times at which CAPs were reduced, combined with the cochlear location traversed by the solution at that time, showed the cochlear origin of the removed CAP component. For low-level tone bursts, the CAP origin along the cochlea was centered at the characteristic frequency (CF). As sound level increased, the CAP center shifted basally for low-frequency tone bursts but apically for high-frequency tone bursts. The apical shift was surprising because it is opposite the shift expected from AN tuning curve and basilar membrane motion asymmetries. For almost all high-level tone bursts, CAP spatial origins extended over 2 octaves along the cochlea. Surprisingly, CAPs evoked by high-level low-frequency (including 2 kHz) tone bursts showed little CAP contribution from CF regions ≤ 2 kHz. Our results can be mostly explained by spectral splatter from the tone-burst rise times, excitation in AN tuning-curve "tails," and asynchronous AN responses to high-level energy ≤ 2 kHz. This is the first time CAP origins have been identified by a spatially specific technique. Our results show the need for revising the interpretation of the cochlear origins of high-level CAPs-ABR wave 1. NEW & NOTEWORTHY Cochlear compound action potentials (CAPs) and auditory brain stem responses (ABRs) are routinely used in laboratories and clinics. They are typically interpreted as arising from the cochlear region tuned to the stimulus frequency. However, as sound level is increased, the cochlear origins of CAPs from tone bursts of all frequencies become very wide and their centers shift toward the most sensitive cochlear region. The standard interpretation of CAPs and ABRs from moderate to intense stimuli needs revision.

Keywords: auditory brain stem response; cochlear action potential; electrocochleography; kainic acid; synaptopathy.


Conflict of interest statement

C. A. Buchman has equity interest in Advanced Cochlear Diagnostics and is a consultant for Advanced Bionics Corporation, Med El Corporation, and Cochlear Corporation. Research projects in C. A. Buchman’s laboratory have been funded by Advanced Bionics Corporation, Med El Corporation, and Cochlear Corporation. A. N. Salt is a paid consultant to Otonomy, Inc., Cochlear Corporation, and Tusker Medical, Inc. Research projects in A. N. Salt’s laboratory have been funded by Cochlear Corporation, Frequency Therapeutics, Inc., and Hoffmann La Roche Pharmaceuticals.

Figures

Fig. 1.
Fig. 1.
Slow perfusion of kainic acid (KA) solution from the cochlear apex to the base reduced responses sequentially from low to high frequencies. A: example auditory nerve compound action potential (CAP) waveforms in response to 16-kHz, 82.5-dB SPL tone bursts. Left to right: before perfusion start, at ~50% reduction (30.4 min after start), and after complete CAP reduction (40.4 min after start). B–H: averages of data from 4 animals. CAP amplitudes evoked by tone bursts with frequencies 2–16 kHz and sound levels in 10-dB steps at and up from the level that evoked 40 μV CAPs (see key). CAP amplitudes were normalized so that the average over the 10 min before the perfusion start was 100%. Error bars are SE. Insets: expanded views around the times when the interpolated CAP amplitudes were reduced by 50% (T50, circles). T50 shows the time (re: the start of the KA perfusion) at which the KA reached the median of the CAP spatial origin. Arrows indicate directions of T50 changes as tone-burst levels increased (double-headed arrow at 8 kHz indicates no systematic T50 change). I–O: difference between successive CAP amplitudes (ΔCAP) from data in B–H. As sound level increased, ΔCAP durations increased and shifted to later perfusion times (origins more toward the cochlear base) for low frequencies but to earlier times (more apical origins) for high frequencies. PV: T50s from the individual ears of the data in B–H relative to the T50 at the lowest level (ΔT50). An increase in ΔT50 with level indicates a shift of the CAP median toward the cochlear base, whereas a decrease in ΔT50 with level indicates a shift of the CAP median toward the cochlear apex.
Fig. 2.
Fig. 2.
A: Relationship between perfusion time and frequency: first, calculated from the flow rate (dashed line), and second, as shown by the observed reduction of auditory nerve compound action potentials (CAPs) from low-level tone bursts (points). Dashed line shows the cochlear characteristic frequency (CF) place reached by the kainic acid (KA) fluid front, based on the fluid perfusion rate being varied to achieve a 0.5 mm/min flow rate of the KA fluid front along the cochlea (Lichtenhan et al. 2016), with place translated to CF with the Tsuji and Liberman (1997) guinea pig cochlear CF place map. For low-level tone bursts that produced 40-μV CAPs, blue circles show the perfusion times at which the CAPs were reduced by 10 μV (Apical 10 μV), green squares show the perfusion times at which the CAPs were reduced to half their original amplitude (50%), and red circles show the perfusion times at which the CAPs were reduced to 10 μV (Basal 10 μV), each as functions of tone-burst frequency. The good correspondence between the actual times that CAPs from a given tone-burst frequency were reduced by 50% and the calculated time at which the KA fluid front reached the CF region for that tone-burst frequency provides evidence that low-level CAPs arise from a cochlear place at or near the tone-burst CF region. B. calculated KA concentrations as a function of time after the start of a KA perfusion from a pipette in the apical-turn scala tympani (ST) of a guinea pig. Solid lines show the calculated concentrations at the cochlear locations listed in the key (in distance from the cochlear base, converted to CF from the map of Tsuji and Liberman 1997). Dashed lines show the threshold concentration for KA to reduce auditory nerve (AN) action potentials (short dashes) and to fully block AN action potentials (long dashes) based on Bledsoe et al. (1981) and Zheng et al. (1999). The initial model used for calculated KA concentrations was based on Salt et al. (1991) and has since been undated and advanced. The model closely approximated ionic marker measurements made along ST of guinea pigs (Mynatt et al. 2006; Salt and Ma 2001). The model yields “best estimates” of KA concentrations, as available pharmacokinetic data on KA are limited.
Fig. 3.
Fig. 3.
Data showing that as tone-burst levels were increased the origins of auditory nerve compound action potentials (CAPs) shifted toward the most sensitive region of the cochlea. A: each point represents the time after the start of the kainic acid (KA) perfusion (top x-axis) at which there was a 50% CAP amplitude reduction (T50) for tone bursts of various frequencies (see key) and sound levels (y-axis). Values are averages of data from N animals (N shown within each square point). At each frequency, the sound level was increased in 10-dB steps from the level that evoked a 40-µV CAP (the lowest point at each frequency). The perfusion rate was varied to achieve a 0.5 mm/min flow rate, which enabled the time from the start of the perfusion (top x-axis) to be mapped to the guinea pig cochlear characteristic frequency (CF) region (bottom x-axis) with the CF map of Tsuji and Liberman (1997). Solid line at bottom (and in B–D, F, and G) shows mean or individual 10-µV CAP thresholds (error bars are SEs). B–D, F, and G: layouts similar to A. B: CAP T50s using 6-dB level steps for tone bursts of 13.5 kHz (red, n = 6 ears) and 16 kHz (purple, n = 4 ears). C and D: CAP T50s from 2 animals (1 per panel) in which the tone bursts went to higher sound levels than in A and B. E: a guinea pig cochlea after the surgical preparation was complete, as seen from the experimenter’s point of view. This view is unusual in that the electrode (identified with a red circle) is on the third cochlear turn, not in the round window (RW) niche. The tympanic membrane (TM) is toward top of the view, RW is to left, the dark strial bands identifying the various cochlear turns in the pigmented guinea pig are accentuated by gray lines, and the cup-shaped dike made with green silicone elastomer surrounds the fenestra where the apical perfusion pipette is sealed into place. F: CAP T50s from an animal with the CAP electrode on the third cochlear turn. G: CAP T50s from an animal where tone bursts were gated with linear (triangles) or cosine-squared (squares) ramps.
Fig. 4.
Fig. 4.
Auditory nerve compound action potential (CAP) response area tuning curves (TCs) become wide at high sound levels. A–M: CAP TCs (10 µV criteria, circles), and the times at which there was a 50% CAP amplitude reduction (T50, squares), calculated from the data in Fig. 1, BO. Square symbols are the same as in Fig. 3A. N and O: lower (N) and upper (O) edges of the TCs, with colors corresponding to those in A–M. Solid lines at bottom of each panel show mean 10-µV CAP thresholds (error bars are SEs).
Fig. 5.
Fig. 5.
Assessing whether tone-burst splatter widens compound action potential (CAP) tuning at high sound levels. A: spectra from 85 dB SPL tone burst onsets measured in a guinea pig ear canal (see key) shown in relationship to the 10-μV CAP threshold curve of Fig. 3A (solid black line; error bars are SEs). B: auditory nerve CAP amplitude as a function of time from perfusion start, for the region around the 50% CAP reductions (T50s, circles). Data from 16-kHz, 70-dB SPL tone bursts of various nominal rise times (see key). Tone bursts with longer rise times required longer perfusion times to achieve T50 (possibly from less spread of excitation to the most sensitive cochlear region). C: CAP amplitude as a function of time from perfusion start for tone bursts that were compensated for rise time-induced changes in spectral splatter by increasing the stimulus level 6 dB for each increase in rise time. The CAP T50s from the splatter-compensated tone bursts were very similar, consistent with the excitation being due to splatter.
Fig. 6.
Fig. 6.
A demonstration that during perfusions of kainic acid (KA) solution auditory nerve compound action potential (CAP) amplitude enhancements sometimes occur just before CAP reductions and that these enhancements are due to the removal of an apical CAP component that is opposite in phase to the dominant, basal CAP component. Data are from CAPs evoked by 2-kHz, 72-dB SPL tone bursts (guinea pig KAF04). Measurements associated with the largest CAP enhancement are red, baseline measurements are black, and all others are gray. A: amplitudes of the CAP waveform measurements (C) made during the perfusion. B: amplitudes of the difference waveforms between the successive waveforms in C and cumulative reduction waveforms (D): Wcr=t=1nW(ti), where W(ti) represents each difference waveform and ti is the average measurement time. Vertical dashed lines represent the N1 and P1 peaks from the baseline. In this region, the red waveform in D is out of phase with the baseline component (black waveform at bottom of D).
Fig. 7.
Fig. 7.
Assessing whether the perfusion fluid reaches the base by flow through scala tympani or through a pathway along the modiolus. A and B: cross-sectional views of the guinea pig cochlea after full perfusion with FM1-43FX. A: FM1-43FX fluorescence (red). Areas where FM1-43FX was quantified are shown in B: the osseous spiral lamina near scala tympani (blue), the spiral ganglion (red), and the central axons of auditory nerve fibers in the modiolus (green). T1–T4, the cochlear turns. C and D: FM1-43FX intensity from the different cochlear turns in the osseous spiral lamina near scala tympani, the spiral ganglion, and the auditory nerve central axons in the modiolus in the ear that received 50% of the normal perfusion time (C) and in the ear that received the full perfusion time (D). FM1-43FX measurements were normalized to those in the 4th turn osseous spiral lamina. Circles are means and error bars are 1 SD of FM1-43FX intensity at each of the 5 or 6 cochlear half-turns. FM1-43FX intensity decreased from the spiral lamina to the spiral ganglion, as expected for delivery of the dye via flow through the spiraling scala tympani.

Similar articles

Cited by

References

    1. Bledsoe SC Jr, Bobbin RP, Chihal DM. Kainic acid: an evaluation of its action on cochlear potentials Hear Res 4: 109–120, 1981. doi:10.1016/0378-5955(81)90040-X. - DOI - PubMed
    1. Bobbin RP, Parker M, Wall L. Thapsigargin suppresses cochlear potentials and DPOAEs and is toxic to hair cells. Hear Res 184: 51–60, 2003. doi:10.1016/S0378-5955(03)00230-2. - DOI - PubMed
    1. Bourien J, Tang Y, Batrel C, Huet A, Lenoir M, Ladrech S, Desmadryl G, Nouvian R, Puel JL, Wang J. Contribution of auditory nerve fibers to compound action potential of the auditory nerve. J Neurophysiol 112: 1025–1039, 2014. doi:10.1152/jn.00738.2013. - DOI - PubMed
    1. Brown DJ, Chihara Y, Curthoys IS, Wang Y, Bos M. Changes in cochlear function during acute endolymphatic hydrops development in guinea pigs. Hear Res 296: 96–106, 2013. doi:10.1016/j.heares.2012.12.004. - DOI - PubMed
    1. Brown DJ, Patuzzi RB. Evidence that the compound action potential (CAP) from the auditory nerve is a stationary potential generated across dura mater. Hear Res 267: 12–26, 2010. doi:10.1016/j.heares.2010.03.091. - DOI - PubMed

Publication types