. 2019 Jan 22;15(1):e1007439.
doi: 10.1371/journal.pgen.1007439. eCollection 2019 Jan.

Transition from a meiotic to a somatic-like DNA damage response during the pachytene stage in mouse meiosis

Affiliations

Transition from a meiotic to a somatic-like DNA damage response during the pachytene stage in mouse meiosis

Andrea Enguita-Marruedo et al. PLoS Genet. .

Abstract

Homologous recombination (HR) is the principal mechanism of DNA repair acting during meiosis and is fundamental for the segregation of chromosomes and the increase of genetic diversity. Nevertheless, non-homologous end joining (NHEJ) mechanisms can also act during meiosis, mainly in response to exogenously-induced DNA damage in late stages of first meiotic prophase. In order to better understand the relationship between these two repair pathways, we studied the response to DNA damage during male mouse meiosis after gamma radiation. We clearly discerned two types of responses immediately after treatment. From leptotene to early pachytene, exogenous damage triggered the massive presence of γH2AX throughout the nucleus, which was associated with DNA repair mediated by HR components (DMC1 and RAD51). This early pathway finished with the sequential removal of DMC1 and RAD51 and was no longer inducible at mid pachytene. However, from mid-pachytene to diplotene, γH2AX appeared as large discrete foci. This late repair pattern was mediated initially by NHEJ, involving Ku70 and XRCC4, which were constitutively present, and 53BP1, which appeared at sites of damage soon after irradiation. Nevertheless, 24 hours after irradiation, a HR pathway involving RAD51 but not DMC1 mostly replaced NHEJ. Additionally, we observed the occurrence of synaptonemal complex bridges between bivalents, most likely representing chromosome translocation events that may involve DMC1, RAD51 or 53BP1. Our results reinforce the idea that the early "meiotic" repair pathway that acts by default at the beginning of meiosis is replaced from mid-pachytene onwards by a "somatic-like" repair pattern. This shift might be important to resolve DNA damage (either endogenous or exogenous) that could not be repaired by the early meiotic mechanisms, for instance those in the sex chromosomes, which lack a homologous chromosome to repair with. This transition represents another layer of functional changes that occur in meiotic cells during mid pachytene, in addition to epigenetic reprograming, reactivation of transcription, changes in the gene expression profile and acquisition of competence to proceed to metaphase.


Conflict of interest statement

The authors have declared that no competing interests exist.

Figures
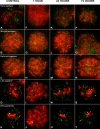
Fig 1
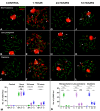
Fig 1. Pattern of γH2AX after irradiation in early prophase mouse spermatocytes.
SYCP3 (green) and γH2AX (red) at different stages of prophase I by recovery time after irradiation. (A-E) Control. (A) Early leptotene. γH2AX localizes as small scattered foci over the short threads of forming AEs. (B) Mid-late leptotene. AEs are more extended and now a massive γH2AX signal covers the nucleus. This pattern is also found in early zygotene (C), when AEs are completely formed and homologues start to synapse. (D) Late zygotene. Homologous chromosomes have nearly completed synapsis. γH2AX signal still occupies large chromatin regions, mostly on the unsynapsed autosomes and the X chromosome (X). The Y chromosome (Y) is devoid of massive γH2AX labeling. (E). Early pachytene. Autosomes are completely synapsed, whereas sex chromosomes show a variable degree of synapsis. γH2AX extends over both sex chromosomes (X and Y) and regions of chromatin around some autosomes (arrows). (F-J) 1 hour of recovery. Increased γH2AX signal is observed in the nucleus of spermatocytes from early leptotene to early pachytene. The signal covers the entire nucleus at all the stages, contrasting with the pattern of control cells. (K-O) 24 hours of recovery. There is an evident decrease in the amount of γH2AX in early leptotene, late zygotene and early pachytene spermatocytes, comparable to the controls. γH2AX localizes around the sex chromosomes, and some foci present in autosomes (arrows). (P-T) 72 hours of recovery. A pattern analogous to that at 24 hours is found. Chromosomal connections involving SYCP3 are observed between some bivalents (arrowhead).
Fig 2
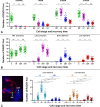
Fig 2. Pattern of γH2AX after irradiation in late prophase mouse spermatocytes.
SYCP3 (green) and γH2AX (red) at different stages of prophase-I by recovery time after irradiation. (A-C) Control. γH2AX appears over the sex chromosomes (X and Y) in mid-pachytene (A), late pachytene (B) and diplotene (C). Occasionally, some small foci remain associated with autosomes (arrowheads). (D-F). 1 hour of recovery. In addition to the sex chromosomes, γH2AX localizes on the autosomes as large foci that emerge from the SCs (arrowheads) at all three stages. (G-I). 24 hours of recovery. All stages show a visible decrease in the amount of γH2AX. In mid-pachytene cells (G), γH2AX foci are almost absent yet many foci are still present in late pachytene (H) and diplotene (I) cells. (J-L). 72 hours of recovery. The pattern is similar to 24 hours; some foci (arrowheads) remain present in late pachytene (K) and diplotene (L) cells. Some chromosomal connections are visible and appear to involve γH2AX signals (arrows). (M) Dotplot of the number of γH2AX foci in spermatocytes grouped by recovery time. The increase in the number of foci is evident 1 hour after irradiation. ANOVA analysis showed no statistical differences at this time between the three stages analyzed (p = 0.22). Tukey's multiple comparisons test for individual comparisons between different stages showed no statistical differences. 24 hours after irradiation, a reduction in the number of foci is observed at all stages, but now statistical differences between stages are observed (ANOVA p≤0.0001). Individual comparisons indicate the existence of differences between all stages. An analogous situation is found 72 hours after irradiation (ANOVA p≤0.0001). (N) Dotplot of the number of γH2AX foci in spermatocytes grouped by stage. While mid-pachytene cells return to levels similar to the control 24 hours after irradiation (p≥0.05), late pachytene and diplotene do not at any time after irradiation. MP: mid-pachytene; LP: late pachytene; D: diplotene; ns: non-significant; *: p≤0.05; **: p≤0.01; ***: p≤0.001; ****: p≤0.0001.
Fig 3
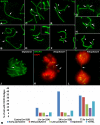
Fig 3. Types of chromosomal bridges found after irradiation.
SYCP3 protein in green. (A-I) Spread spermatocytes at pachytene, except (G), which is at zygotene. (A) Distal junction between two autosomes. (B) Distal junction between an autosome and a sex chromosome, in this case the X. (C-D) Interstitial junctions between autosomal bivalents. In (C) a bivalent with two bridges, each contacting a different bivalent, is shown. In the inset, a higher power view of one of the bridges is shown. The lateral element of the homologue involved in the bridge is split into two filaments. One filament remains associated with the homologous chromosome and the other is linked to the chromosome of the other bivalent. In (D) two bivalents are sharing a bridge. In this case, the bridge is a whole counterpart, which has invaded the other bivalent. A higher power view of the bridge is shown in the inset. (E) Interstitial junctions between an autosomal bivalent and the X chromosome (X). In (F) a bridge is formed between an autosomal bivalent and the Y chromosome (Y). (G) Chromosomal bridge within an autosomal bivalent. (H) Chromosomal bridge within the X chromosome (X). (I) Chromosomal bridge within the Y chromosome (Y). (J-L) Squashed spermatocytes. DNA was counterstained with DAPI and false colored in red. (J) Bridges are seen in 3-dimension conserved cells. During anaphase-I (K) and telophase-I (L), chromosomal fragments and connections (arrows) are observed. (M). Graph showing the frequency of cells showing at least one bridge at the different cell stages of prophase-I and at the different time points after irradiation. The number of cells with bridges increases with recovery time. Chromosomal connections are especially represented in early pachytene cells. n = total number of cells analyzed.
Fig 4
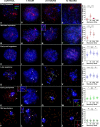
Fig 4. Pattern of DMC1 at different stages of prophase-I by recovery time after irradiation.
SYCP3 (red), γH2AX (blue) and DMC1 (green). (A-F) Control. (A) Early leptotene. A few small foci of DMC1 appear distributed throughout the nucleus; however, they do not seem to specifically co-localize with SYCP3 or γH2AX. (B) Mid-late leptotene. DMC1 foci are more abundant and now mostly associated with short SYCP3 filaments. (C). Early-mid zygotene. DMC1 foci are very abundant over the formed AEs, some of which are undergoing synapsis. (D). Late zygotene. DMC1 foci are located over both synapsed and unsynapsed chromosomes. Some signal co-localizes with remaining clouds of γH2AX, while others do not. The X chromosome (X) appears coated with many foci, while only a single focus is seen on the Y chromosome (Y). Gradually, DMC1 foci disappear during early pachytene (E) and mid-pachytene (F), but remain on the sex chromosomes and some autosomes. Only occasionally do some of these DMC1 foci co-localize with γH2AX (see enlarged detail of the bivalent indicated by an arrow in E). (G-L) 1 hour of recovery. The number of DMC1 foci increases at all stages from leptotene to early pachytene. At early leptotene (G), DMC1 coincides with the increase and spread of γH2AX to the whole nucleus. The number of DMC1 foci is clearly higher than in the control shown in A. No conspicuous differences in the pattern of DMC1 are observed at late leptotene (H) or zygotene (I-J). The Y chromosome still shows a single DMC1 focus. In early (K) and mid-pachytene (L) spermatocytes, DMC1 is observed on autosomes and sex chromosomes. Again, DMC1 foci may co-localize or not with γH2AX. Enlarged views of some bivalents (arrows) are shown as insets in panels K and L. Chromosomal bridges are also found (arrowheads). (M-R) 24 hours of recovery. The distribution of γH2AX resembles that of control cells at all stages but the number of DMC1 foci seems reduced compared with cells 1 hour after irradiation. In some cells DMC1 appears to form filaments, sometimes joining AEs together (see arrowheads and detail in N). (S-Z). 72 hours of recovery. Leptotene cells (S-T) are found at a very low frequency and usually include morphological distortions. The morphological features of cells from zygotene to mid-pachytene are similar to those found at 24 hours. Again, small DMC1 filaments appear on the chromosomes. These filaments seem to occasionally mediate the formation of bridges between two bivalents (arrowheads and details in W and Z); in some cases, γH2AX signal is associated with bridges (Z). A’-F’) Dotplot representation of DMC1 foci distribution by cell stage. ANOVA analysis showed that the number of DMC1 foci increased at all stages after irradiation (p≤0.0001) except mid-pachytene (p = 0.93). The increase of DMC1 foci observed 1 hour after irradiation compared to control is lower as cells are in more advances stages, and no increase is found at mid pachytene. Likewise, differences in the number of foci between 1 and 24 hours, or between 24 and 72 hours, become less or not significant as cells are in later stages. Nevertheless, control levels in terms of number of foci were not observed for any of the stages, even after 72 hours of recovery, except obviously mid pachytene. Tukey's multiple comparisons test for individual comparisons (ns: non-significant; *: p≤0.05; **: p≤0.01; ***: p≤0.001; ****: p≤0.0001).
Fig 5
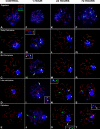
Fig 5. Pattern of RAD51 at different stages of prophase-I by different recovery time after irradiation.
SYCP3 (red), γH2AX (blue) and RAD51 (green). (A-F) Control. (A) Late Zygotene. RAD51 foci are found in the non-synaptic AEs, which are also labeled with γH2AX, some synapsed autosomes and the sex chromosomes (X and Y). During early (B) and mid (C) pachytene, fewer RAD51 foci are observed. Some remain on the autosomes, but most are in the non-synapsed region of the X chromosome. RAD51 does not appear during the late pachytene (D) and diplotene (E). (F-J) 1 hour of recovery. Irradiation induces RAD51 in zygotene (F) and early pachytene (H) spermatocytes. RAD51 can still be detected in late pachytene (I) and diplotene (J) spermatocytes. Most RAD51 foci are located over the AEs or SCs. Enlarged views of selected bivalents (white arrows) allow to discern RAD51 foci co-localizing with γH2AX (white arrowheads), RAD51 foci alone (green arrowheads) and γH2AXfoci alone (blue arrowheads). Some RAD51 foci are clearly detached from the AEs or SCs (green arrows in J). (K-O) 24 hours of recovery. RAD51 coincides with γH2AX during zygotene (K), while at later stages (L-O), co-localization of the two signals does not always occur (see detail in N). In late pachytene (N) and diplotene (O) spermatocytes, RAD51 foci are more abundant than at 1 hour. Foci are also larger. Green arrows indicate RAD51 foci not associated with SCs. (P-T) 72 hours of recovery. The pattern is similar to the results obtained after 24 hours of recovery. Most RAD51 foci are large and coincide with γH2AX during late pachytene (S) and diplotene (T).
Fig 6
Fig 6. Dotplot representation of RAD51 foci distribution.
(A) Analysis of RAD51 distribution by recovery time. Four substages were considered (MP: mid pachytene; LP: late pachytene; ED: early diplotene; LD: late diplotene). ANOVA analysis showed statistical differences (p≤0.0001) for the control and the three recovery times. In the control, MP cells have a high number of RAD51 foci but later-staged cells have little to none. A similar increase in the number of RAD51 foci is observed from LP to LD 1 hour after irradiation. Tukey's multiple comparisons test for individual comparisons showed statistical differences between MP and the rest of the stages, and also between LP and LD. Twenty-four hour after irradiation, the increase in the number of RAD51 is more obvious at all stages, while 72 hours after irradiation, the number of foci decreases from LP to LD. (B) Analysis of RAD51 distribution by cell stage. The number of RAD51 foci increases significantly in cells at all stages after irradiation (p≤0.0001). However, according to Tukey's test, the number of foci in irradiated mid-pachytene cells 1 hour after irradiation is not significantly different from control cells. At 24 hours, the number of foci increases in mid-pachytene cells and remains stable at 72 hours. This distribution departs from the pattern observed in cells at other stages, in which RAD51 increases slightly at 1 hour, peaks at 24 hours and then decreases at 72 hours. (ns: non-significant; *: p≤0.05; **: p≤0.01; ***: p≤0.001; ****: p≤0.0001). (C). Analysis of RAD51 foci associated (ON) or not associated (OFF) with SCs at early (blue) and late diplotene (brown). The distribution of both kinds of foci is similar, increasing at 1 hour, peaking at 24 hours and decreasing at 72 hours. Notably, the proportion of foci not associated with SCs (OFF) is higher in late diplotene spermatocytes.
Fig 7
Fig 7. Distribution of NHEJ markers at different stages of prophase-I by recovery time after irradiation.
SYCP3 (green) and XRCC4 (red) in late prophase-I spermatocytes. (A-C) Control. XRCC4 is absent up to mid-pachytene (A). At late pachytene (B), a faint signal is observed in the nucleus, which becomes more intense at diplotene (C). The signal appears more concentrated on the sex chromosomes (XY). (D-F) 1 hour, (G-I) 24 hours and (J-L) 72 hours after irradiation. The localization pattern of XRCC4 at each stage is almost identical. Foci do not form at any stage or recovery time.
Fig 8
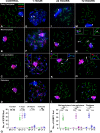
Fig 8. Pattern of 53BP1 at different stages of prophase-I by recovery time after irradiation.
SYCP3 (red), γH2AX (blue) and 53BP1 (green). (A-D) Control. 53BP1 is first detected at mid-pachytene (B) over the sex chromosomes and is maintained during late pachytene (C) and diplotene (D). During diplotene, the signal weakens, becoming no longer detectable by the end of this stage. The 53BP1 signal co-localizes with γH2AX over the sex chromosomes, X and Y. (E-H) 1 hour of recovery. From mid-pachytene (F) onwards, a large number of 53BP1 foci appear on the autosomes as diffuse clouds emerging from the SCs. The 53BP signal is similarly maintained in late pachytene (G) and diplotene (H) spermatocytes, although foci become smaller as prophase-I progresses. Arrows indicate the bivalents shown in details. These 53BP1 signals largely coincide those of γH2AX (red arrowheads), although γH2AX foci without 53BP1 are also present (blue arrowheads) (see detail in G). (I-L) 24 hours of recovery. A noticeable decrease in the number of 53BP1 and γH2AX foci occurs relative to the 1-hour time point. In some cases, these foci coincide with those of γH2AX (red arrowhead in left detail in K) and in others they do not (blue arrowhead right detail in K). (M-P) 72 hours of recovery. The number and distribution of 53BP1 and γH2AX foci are similar to those at 24 hours. The presence of two interstitial bridges between autosomal bivalents (arrows) can be more clearly seen in the enlarged details in (N). γH2AX is observed on one of the bridges (right), whereas both γH2AX and 53BP1 are co-localized on the other (left). (Q) Dotplot of the number of 53BP1 foci in spermatocytes grouped by recovery times. Three substages were considered (MP: mid pachytene; LP: late pachytene; ED: early diplotene). Increased numbers of foci are evident 1 hour after irradiation. ANOVA analysis showed statistical differences at this time between the three stages analyzed (p≤0.0001). Tukey's multiple comparisons test for individual comparisons between different stages showed no statistical differences between LP and ED cells. A reduction is observed in the number of foci in cells at all stages 24 hours after irradiation. An analogous situation is found 72 hours after irradiation. (R) Dotplot of the number of 53BP1 foci in spermatocytes grouped by stage. Cells at all stages return to control levels 72 hours after irradiation. ns: non-significant; *: p≤0.05; **: p≤0.01; ***: p≤0.001; ****: p≤0.0001.
Fig 9
Fig 9. Model for the transition of the DNA damage response during meiosis.
The early (meiotic) response works from early leptotene up to mid-pachytene and is characterized by the action of HR mechanisms. This is the default pathway, likely due to the programmed resection of DNA upon SPO11 removal, which would hamper the action of NHEJ mechanisms. The meiotic response involves broad phosphorylation of γH2AX in the nucleus, likely in association with changes in chromatin organization, epigenetic modifications and transcriptional silencing, characteristic features of spermatocytes at these stages. DMC1 and RAD51 work together during this early response. DMC1 is removed first, leaving only RAD51 at the last stages of this response, which may affect interhomolog bias in the repair of DSBs. Induction of additional exogenous DSBs (but also potentially spontaneous, SPO11-independent ones) triggers an identical meiotic response, marked by the massive γH2AX localization throughout the nucleus and the increase of DMC1 and RAD51 in cells at all stages up to mid pachytene. Although γH2AX is quickly removed, many unresolved DNA damage intermediates accumulate even after long periods of recovery, indicating that this mechanism is not completely efficient. The dual late response very much resembles the response of somatic cells, including the appearance of discrete γH2AX foci. NHEJ is the first mechanism activated in this late somatic-like response, triggered soon after induction of DSBs from mid-pachytene onwards. Some factors, like 53BP1, may already be present and localized on the sex chromosomes, with others (Ku70, XRCC4) appearing by default during late pachytene. This mechanism can quickly respond to DNA damage and, under normal conditions, likely resolve most, if not all, endogenously generated DSBs. However, after the induction of an exceeding number of DSBs, the initial NHEJ response is replaced by a HR one, involving only RAD51. Although this somatic-like response is less efficient in removing γH2AX than the early meiotic response, its overall repair efficiency is probably similar. Indeed, lower accumulation of unresolved intermediates is observed for this late response after long periods of recovery. The transition between these two DNA damage responses clearly occurs during mid pachytene, when the meiotic response is no longer inducible and the somatic-like one becomes available. This transition indicates a possible physiological shift in meiotic cells as they prepare for further stages of first meiotic division and, more relevantly, chromosome segregation.

Similar articles

Cited by

References

    1. Ceccaldi R, Rondinelli B, D’Andrea AD (2016) Repair Pathway Choices and Consequences at the Double-Strand Break. Trends in cell biology 26: 52–64. 10.1016/j.tcb.2015.07.009 - DOI - PMC - PubMed
    1. Shibata A (2017) Regulation of repair pathway choice at two-ended DNA double-strand breaks. Mutat Res. 803–805:51–55. 10.1016/j.mrfmmm.2017.07.011 . - DOI - PubMed
    1. Langerak P, Russell P (2011) Regulatory networks integrating cell cycle control with DNA damage checkpoints and double-strand break repair. Philos Trans R Soc Lond B Biol Sci 366: 3562–3571. 10.1098/rstb.2011.0070 - DOI - PMC - PubMed
    1. Grabarz A, Barascu A, Guirouilh-Barbat J, Lopez BS (2012) Initiation of DNA double strand break repair: signaling and single-stranded resection dictate the choice between homologous recombination, non-homologous end-joining and alternative end-joining. Am J Cancer Res 2: 249–268. - PMC - PubMed
    1. Her J, Bunting SF (2018) How cells ensure correct repair of DNA double-strand breaks. Journal of Biological Chemistry 293:10502–10511. 10.1074/jbc.TM118.000371 . - DOI - PMC - PubMed

Publication types

MeSH terms

Grants and funding

This work was supported by grants BFU2009-10987 from the Ministerio de Ciencia e Innovación and CGL2014-53106-P from the Ministerio de Economia y Competitividad (Spain). The funders had no role in study design, data collection and analysis, decision to publish, or preparation of the manuscript.