. 2019 Feb;21(2):162-168.
doi: 10.1038/s41556-018-0263-4. Epub 2019 Jan 21.

Multicolour single-molecule tracking of mRNA interactions with RNP granules

Affiliations

Multicolour single-molecule tracking of mRNA interactions with RNP granules

Stephanie L Moon et al. Nat Cell Biol. 2019 Feb.

Abstract

Ribonucleoprotein (RNP) granules are non-membrane-bound organelles that have critical roles in the stress response1,2, maternal messenger RNA storage3, synaptic plasticity4, tumour progression5,6 and neurodegeneration7-9. However, the dynamics of their mRNA components within and near the granule surface remain poorly characterized, particularly in the context and timing of mRNAs exiting translation. Herein, we used multicolour single-molecule tracking to quantify the precise timing and kinetics of single mRNAs as they exit translation and enter RNP granules during stress. We observed single mRNAs interacting with stress granules and P-bodies, with mRNAs moving bidirectionally between them. Although translating mRNAs only interact with RNP granules dynamically, non-translating mRNAs can form stable, and sometimes rigid, associations with RNP granules with stability increasing with both mRNA length and granule size. Live and fixed cell imaging demonstrated that mRNAs can extend beyond the protein surface of a stress granule, which may facilitate interactions between RNP granules. Thus, the recruitment of mRNPs to RNP granules involves dynamic, stable and extended interactions affected by translation status, mRNA length and granule size that collectively regulate RNP granule dynamics.


Figures
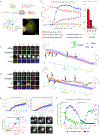
Fig. 1.
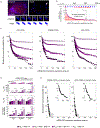
Fig. 1.. mRNAs are translationally repressed prior to entry into SGs and resume translation following SG disassembly.
(a) Single mRNAs with 24×MS2 stem loops in the 3’UTR are visualized with JF646-MCP (red) and translation observed by anti-FLAG Cy3-Fab (green) binding the N-terminal ORF 10×FLAG tags in U-2 OS cells expressing the SG marker GFP-G3BP1 (blue); a representative cell (from 10 we analyzed in detail in (b)) is shown (scale bar, 10 μm). (b) Simultaneous detection of mRNA localization, translation activity, and SG formation in arsenite-stressed cells. Left, normalized number of SGs per cell (i.e. fraction of maximal number of SGs observed in each cell throughout the stress, blue); fraction of cytoplasmic non-translating (red) and translating (yellow) mRNAs; fraction of SG-localized translating (brown) and non-translating (purple) mRNAs. Right, fraction of cytoplasmic or SG-localized translating or non-translating mRNAs at 40 minutes post-stress. Avg. ± SEM shown from n=10 cells collected from 3 independent experiments. (c and d) Left, representative images of single mRNAs (red), their translation activity (green), and SG (blue) interactions (scale bars, 1 μm). Right, graphical representation of interactions with intensity of translation foci represented as white-green. (c) A representative long-term mRNA-SG interaction (>3 min) from 82 non-translating mRNAs tracked from 9 cells collected from 3 independent experiments. (d) An example of transient translating mRNA-SG interactions from 334 translating mRNAs tracked from 9 cells collected from 3 independent experiments. (e) SG growth over time, as average SG size (upper left) and average SG intensity (upper right). Growth of individual SGs (lower left) with fusion events shown graphically (t1 and t2) and as a representative time series (lower right, scale bar, 5 μm). Avg. ± SEM shown from n=10 cells collected from 3 independent experiments. (f) Representative data from a single cell (from 4 cells collected from 2 independent experiments) showing translation resumption after arsenite washout. Number of translation foci (green) and SGs (blue) during stress (0-70 min) and following washout (80-140 min). Source data are provided in Supplementary Table S2.
Fig. 2.
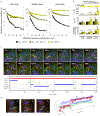
Fig. 2.. mRNAs interact transiently and stably with SGs.
(a) Determination of mRNA-SG interaction times. Representative image (from 9 cells expressing KDM5B mRNA we analyzed in detail in (c)) showing mRNAs (red) and SGs (blue) (upper left, scale bar, 10 μm) and the masked image (upper right) with a representative mRNA-SG interaction (arrow) shown below (scale bar, 1 μm). (b) Survival probability distribution of mRNA-SG interaction times (red) from one representative cell from 9 cells expressing KDM5B mRNA we analyzed in detail in (c). (c) The binding time survival probability (%) of H2B (left; data were calculated from 492 tracked SGs from 11 cells collected from 3 independent experiments), KDM5B (middle; data were collected from 409 tracked SGs from 9 cells collected from 4 independent experiments) and p300 (right; data were calculated from 824 tracked SGs from 16 cells from 4 independent experiments) mRNA-SG interactions are shown partitioned by SG size (legend at bottom). (d) Data in (c) was fit, resulting in average (±90% CI) fitted slow and fast mRNA-SG interaction times, tslow (top), tfast (middle), and % mRNA bound to SGs in the slow interaction mode (“slow state”). Fitted results are shown for H2B, KDM5B and p300 mRNAs for a given effective SG radius (“RSG”, legend at bottom). Two-sided t-tests were performed with * indicating p ≤ 0.05, ** p ≤ 0.01, ** p ≤ 0.005, **** p ≤ 0.001 and df=44. Statistics source data for Fig 2d can be found in Tables S2 and S3. Fitting was performed once to the collective data set shown in (c). (e) The average binding time survival probability (%) (±90% CI) of KDM5B (left; data were calculated from 326 tracked SGs from 9 cells collected from 3 independent experiments) and p300 (right; data were calculated from 336 tracked SGs from 10 cells collected from 4 independent experiments) mRNAs associated with nascent chains is shown with graphical insets showing the full distribution (adjusted xy-axes). Source data is provided in Tables S2.
Fig. 3.
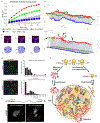
Fig. 3.. mRNAs interact transiently and stably with PBs in stressed cells and traffic bidirectionally between PBs and SGs.
(a) Average binding time survival probability distributions of H2B mRNA-PB (left; data were calculated from 106 tracked PBs of 4 cells from one experiment), KDM5B mRNA-PB (middle; data were calculated from 137 tracked PBs of 7 cells collected from 3 independent experiments), and p300 mRNA-PB (right; data were calculated from 244 tracked PBs of 16 cells collected from 4 independent experiments) for a given effective PB radius (“RPB”, legend at bottom). (b) Data in (a) was fitted, resulting in average fitted fast and slow interaction times and % mRNA bound to PBs in the slow interaction mode (“slow state”). Fitted results are shown (±90% CI) for H2B, KDM5B or p300 mRNAs for each effective PB radius (legend in (a)). Two-sided t-tests were performed with * indicating p ≤ 0.05, ** p ≤ 0.01, ** p ≤ 0.005, **** p ≤ 0.001, df = 31. Statistics source data for Fig 3b can be found in Tables S2 and S3. Fitting was performed once to the collective data set shown in (a). (c) Representative images (top, scale bar, 1 μm) (from 6 cells collected from 4 independent experiments) of a single KDM5B mRNA (red, red arrows) that interacted with four SGs (blue, blue arrows) and two PBs (green, green arrows). The duration of each mRNA-RNP granule interaction was plotted (bottom). (d) A representative mRNA trajectory (from 3 cells collected from 2 independent experiments) between two SGs and a PB visualized by plotting the position of the mRNA (red), SG (blue), and PB (green) over time. Example cropped images corresponding to time points t1 to t3 are shown (left, scale bar, 1 μm). Source data is provided in Supplementary Table S2.
Fig. 4.
Fig. 4.. mRNAs can be rigidly positioned within SGs and/or tethered to them.
(a) Average mean squared displacement (MSD) (±90%CI) of cytoplasmic KDM5B mRNAs (red; fitted D=0.016±0.004 μm2/sec), mRNAs with nascent chains (green; fitted D=0.011±0.002 μm2/sec), SGs (blue; fitted D=0.003±0.0006 μm2/sec), SGs containing mRNAs (purple; fitted D=0.004±0.0004 μm2/sec), and mRNAs in SGs (gray; fitted D=10±2 nm2/sec) from n=7 cells from 2 independent experiments; 1243 mRNAs, 108 mRNAs with nascent chains, 1049 SGs, 92 SGs containing mRNAs and 3 mRNAs tracked in 3D within one SG). (b) Representative time series (from 2 cells collected from 2 independent experiments) showing three KDM5B mRNAs (red foci marked by red, blue and green arrows, top, scale bar, 1 μm) and their 3D positions (as red, green or blue dots, bottom) in a SG. (c) Projected 2D positions (top) and relative 3D positions (bottom) of the three mRNAs in (b) plotted over time (green mRNA position fixed and blue mRNA oriented relative to green mRNA). Frames in (b) indicated as t1, t2 and t3 (black arrows). Yellow arrows indicate exit and entrance of the red mRNA from the SG (from 2 cells collected from 2 independent experiments). (d) Representative immunofluorescence-smFISH images for AHNAK (n=4 cells) and NORAD (n=4 cells) RNAs (red) and SGs (G3BP1, green) at 60 min. post-stress. Left, representative images of RNAs clustered near SGs (white circles). Images shown represent data from 4 cells collected from one experiment. Scale bar, 0.5μm. Right, relative frequency of distances of 50 AHNAK or NORAD RNAs to the nearest SG. (e) Schematic of AHNAK smFISH probe positions (top). (Bottom) Representative smFISH images where one end of the AHNAK mRNA was outside the SG while the other end was inside the SG (5’ probes in red, 3’ probes in green; SG in grey) (n=14 cells collected from one experiment). Scale bars, 1μm. Source data in Tables S2. (f) Model. Translation repression causes ribosomes to run off transcripts, which interact transiently with SGs via docking and undocking. Some transcripts then enter a stable association (‘lock’) with SGs and may engage in multivalent interactions with other RNAs and proteins. Transcripts may be tethered to the SG surface, perhaps facilitating SG growth or docking of P-bodies. Those transcripts remaining in translation complexes can only transiently interact with SGs.

Comment in

Similar articles

Cited by

References

    1. Buchan JR & Parker R Eukaryotic stress granules: the ins and outs of translation. Mol. Cell 36, 932–941 (2009). - PMC - PubMed
    1. Kedersha N, Ivanov P & Anderson P Stress granules and cell signaling: more than just a passing phase? Trends Biochem. Sci. 38, 494–506 (2013). - PMC - PubMed
    1. Schisa JA Effects of stress and aging on ribonucleoprotein assembly and function in the germ line. Wiley Interdiscip. Rev. RNA 5, 231–246 - PMC - PubMed
    1. Sudhakaran IP et al. FMRP and Ataxin-2 function together in long-term olfactory habituation and neuronal translational control. Proc. Natl. Acad. Sci. U. S. A 111, E99–E108 (2014). - PMC - PubMed
    1. El-Naggar AM & Sorensen PH Translational control of aberrant stress responses as a hallmark of cancer. J. Pathol 244, 650–666 (2018). - PubMed

Publication types

MeSH terms