

Geographic Distribution and Survival Outcomes for Rural Patients With Cancer Treated in Clinical Trials
- PMID: 30646114
- PMCID: PMC6324281
- DOI: 10.1001/jamanetworkopen.2018.1235
Geographic Distribution and Survival Outcomes for Rural Patients With Cancer Treated in Clinical Trials
Abstract
Importance: Studies showing that patients with cancer from rural areas have worse outcomes than their urban counterparts have relied on cancer population data and did not account for differences in access to care. Clinical trial patients receive protocol-directed care by design, so large clinical trial databases are ideal for examining the impact of rural vs urban residency on outcomes.
Objective: To compare the geographic distribution and survival outcomes for rural vs urban patients with cancer treated in clinical trials.
Design, setting, and participants: In this comparative effectiveness retrospective cohort analysis, 36 995 patients from all 50 states enrolled in 44 phase 3 and phase 2/3 SWOG (formerly the Southwest Oncology Group) treatment trials from January 1, 1986, to December 31, 2012, were examined. Seventeen different cancer-specific analysis cohorts were constructed. Data through January 30, 2018, were analyzed.
Main outcomes and measures: Rural vs urban residency was defined using the Rural-Urban Continuum Codes developed by the US Department of Agriculture. Multivariate Cox regression was used to estimate the association of residency with overall survival, progression-free survival, and cancer-specific survival, controlling for major disease-specific prognostic factors and demographic variables and stratifying by study. Different definitions of rurality were examined. The distribution of rural vs urban patients by geographic region was described.
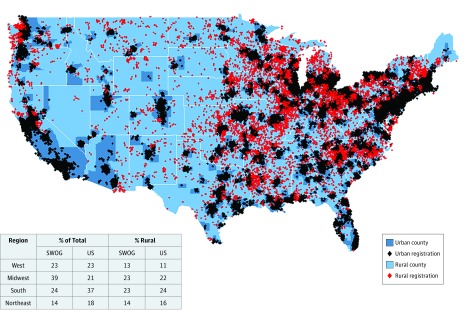
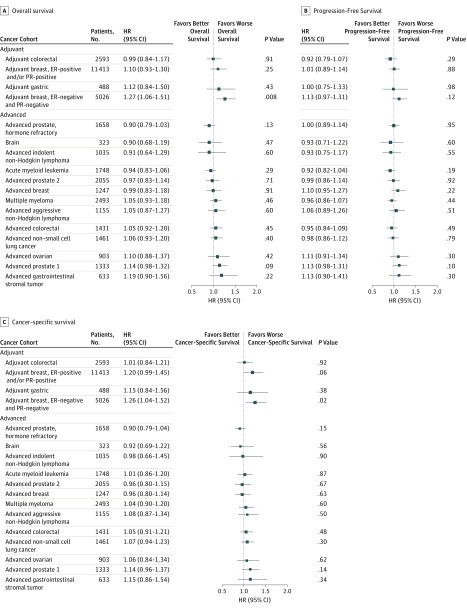
Results: Overall, 27.7% of patients were 65 years or older (range across 17 cohort analyses, 7.8%-74.5%), 40.3% were female in the non-sex-specific analyses (range across 17 cohort analyses, 28.1%-45.9%), and 10.8% were black (range across 17 cohort analyses, 1.9%-22.4%). Overall, 19.4% of patients (7184 of 36 995) were from rural locations. Rural patients were more likely to be aged 65 years or older (rural, 30.7% aged ≥65 years vs urban, 27.0% aged ≥65 years; difference, 3.7%; 95% CI, 2.5%-4.9%; P < .001), were less likely to be black (rural, 5.4% vs urban, 12.1%; difference, 6.7%; 95% CI, 6.1%-7.3%; P < .001), were similar with respect to sex (rural, 40.4% female vs urban, 39.7% female; difference, 0.6%; 95% CI, -1.4% to 2.6%; P = .53), and were well represented within major US geographic regions (West, Midwest, South, and Northeast). Clinical prognostic factors were similar. In multivariable regression, rural patients with adjuvant-stage estrogen receptor-negative and progesterone receptor-negative breast cancer had worse overall survival (hazard ratio, 1.27; 95% CI, 1.06-1.51; P = .008) and cancer-specific survival (hazard ratio, 1.26; 95% CI, 1.04-1.52; P = .02). No other statistically significant differences for overall, progression-free, or cancer-specific survival were found. Results were consistent regardless of the definition of rurality.
Conclusions and relevance: Rural and urban patients with uniform access to cancer care through participation in a SWOG clinical trial had similar outcomes. This finding suggests that improving access to uniform treatment strategies for patients with cancer may help resolve the disparity in cancer outcomes between rural and urban patients.
Conflict of interest statement
Figures

Comment in
-
Identifying and Addressing Disparities in Survival Outcomes for Rural Patients With Cancer.JAMA Netw Open. 2018 Aug 3;1(4):e181243. doi: 10.1001/jamanetworkopen.2018.1243. JAMA Netw Open. 2018. PMID: 30646109 No abstract available.
Similar articles
-
Persistent Disparity: Socioeconomic Deprivation and Cancer Outcomes in Patients Treated in Clinical Trials.J Clin Oncol. 2021 Apr 20;39(12):1339-1348. doi: 10.1200/JCO.20.02602. Epub 2021 Mar 17. J Clin Oncol. 2021. PMID: 33729825 Free PMC article.
-
Residence in Rural Areas of the United States and Lung Cancer Mortality. Disease Incidence, Treatment Disparities, and Stage-Specific Survival.Ann Am Thorac Soc. 2017 Mar;14(3):403-411. doi: 10.1513/AnnalsATS.201606-469OC. Ann Am Thorac Soc. 2017. PMID: 28118039
-
Rurality, Stage-Stratified Use of Treatment Modalities, and Survival of Non-small Cell Lung Cancer.Chest. 2020 Aug;158(2):787-796. doi: 10.1016/j.chest.2020.04.042. Epub 2020 May 6. Chest. 2020. PMID: 32387525 Free PMC article.
-
Cost-effectiveness of using prognostic information to select women with breast cancer for adjuvant systemic therapy.Health Technol Assess. 2006 Sep;10(34):iii-iv, ix-xi, 1-204. doi: 10.3310/hta10340. Health Technol Assess. 2006. PMID: 16959170 Review.
-
Increased Variation in Esophageal Cancer Treatment and Geographic Healthcare Disparity in Michigan.J Am Coll Surg. 2023 Nov 1;237(5):779-785. doi: 10.1097/XCS.0000000000000819. Epub 2023 Aug 15. J Am Coll Surg. 2023. PMID: 37581370 Review.
Cited by
-
Epidemiological Study of Adenoid Cystic Carcinoma and Its Outcomes: Insights from the Surveillance, Epidemiology, and End Results (SEER) Database.Cancers (Basel). 2024 Oct 3;16(19):3383. doi: 10.3390/cancers16193383. Cancers (Basel). 2024. PMID: 39410002 Free PMC article.
-
Quantifying geographical accessibility to cancer clinical trials in different income landscapes.ESMO Open. 2022 Jun;7(3):100515. doi: 10.1016/j.esmoop.2022.100515. Epub 2022 Jun 21. ESMO Open. 2022. PMID: 35738201 Free PMC article.
-
Geographic differences in community oncology provider and practice location characteristics in the central United States.J Rural Health. 2022 Sep;38(4):865-875. doi: 10.1111/jrh.12663. Epub 2022 Apr 5. J Rural Health. 2022. PMID: 35384064 Free PMC article.
-
Improving cancer care locally: Study of a hospital affiliate network model.J Rural Health. 2022 Sep;38(4):827-837. doi: 10.1111/jrh.12639. Epub 2021 Dec 13. J Rural Health. 2022. PMID: 34897807 Free PMC article.
-
Rural comprehensive cancer care: Qualitative analysis of current challenges and opportunities.J Rural Health. 2024 Sep;40(4):634-644. doi: 10.1111/jrh.12842. Epub 2024 May 16. J Rural Health. 2024. PMID: 38753418
References
-
- US Census Bureau Measuring America: our changing landscape. https://www.census.gov/content/dam/Census/library/visualizations/2016/co.... Published December 8, 2016. Accessed May 17, 2018.
-
- National Cancer Institute National Cancer Advisory Board Cancer Moonshot Blue Ribbon Panel Report. https://www.cancer.gov/research/key-initiatives/moonshot-cancer-initiati.... Published October 17, 2016. Accessed January 26, 2018.
-
- Berger ML, Mamdani M, Atkins D, Johnson ML. Good research practices for comparative effectiveness research: defining, reporting and interpreting nonrandomized studies of treatment effects using secondary data sources: the ISPOR Good Research Practices for Retrospective Database Analysis Task Force Report—Part I. Value Health. 2009;12(8):1044-1052. doi:10.1111/j.1524-4733.2009.00600.x - DOI - PubMed
Publication types
MeSH terms
Grants and funding
LinkOut - more resources
Full Text Sources
Research Materials
