

Early increase of CSF sTREM2 in Alzheimer's disease is associated with tau related-neurodegeneration but not with amyloid-β pathology
- PMID: 30630532
- PMCID: PMC6327425
- DOI: 10.1186/s13024-018-0301-5
Early increase of CSF sTREM2 in Alzheimer's disease is associated with tau related-neurodegeneration but not with amyloid-β pathology
Abstract
Background: TREM2 is a transmembrane receptor that is predominantly expressed by microglia in the central nervous system. Rare variants in the TREM2 gene increase the risk for late-onset Alzheimer's disease (AD). Soluble TREM2 (sTREM2) resulting from shedding of the TREM2 ectodomain can be detected in the cerebrospinal fluid (CSF) and is a surrogate measure of TREM2-mediated microglia function. CSF sTREM2 has been previously reported to increase at different clinical stages of AD, however, alterations in relation to Amyloid β-peptide (Aβ) deposition or additional pathological processes in the amyloid cascade (such as tau pathology or neurodegeneration) remain unclear. In the current cross-sectional study, we employed the biomarker-based classification framework recently proposed by the NIA-AA consensus guidelines, in combination with clinical staging, in order to examine the CSF sTREM2 alterations at early asymptomatic and symptomatic stages of AD.
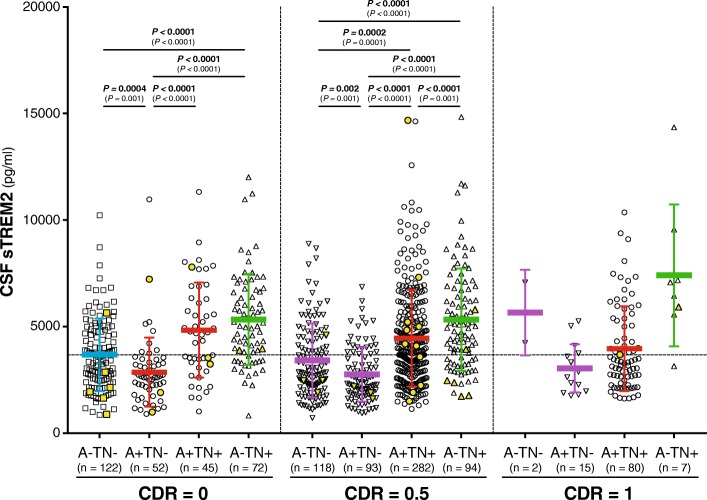
Methods: A cross-sectional study of 1027 participants of the Alzheimer's Disease Imaging Initiative (ADNI) cohort, including 43 subjects carrying TREM2 rare genetic variants, was conducted to measure CSF sTREM2 using a previously validated enzyme-linked immunosorbent assay (ELISA). ADNI participants were classified following the A/T/N framework, which we implemented based on the CSF levels of Aβ1-42 (A), phosphorylated tau (T) and total tau as a marker of neurodegeneration (N), at different clinical stages defined by the clinical dementia rating (CDR) score.
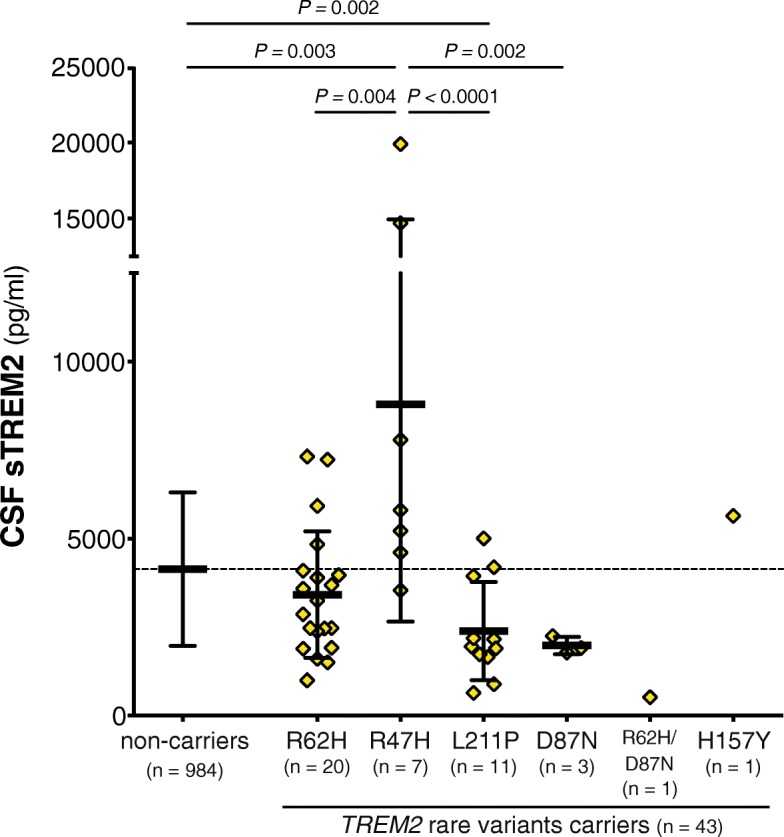
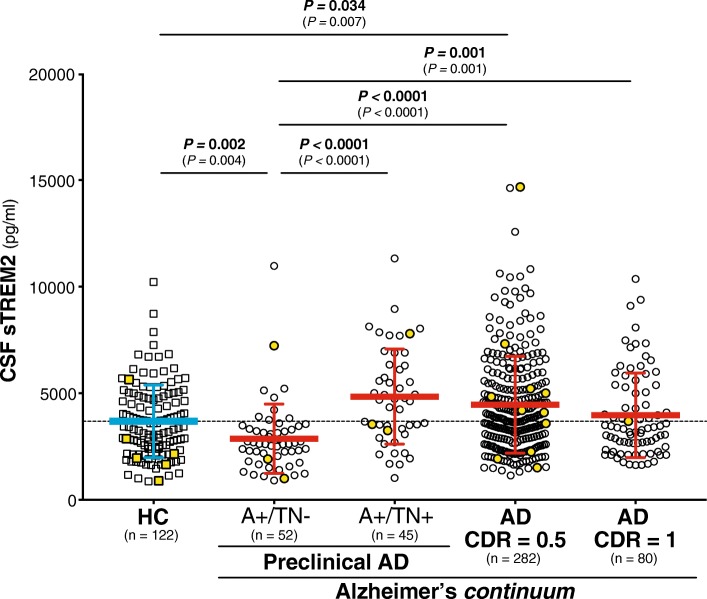
Results: CSF sTREM2 differed between TREM2 variants, whereas the p.R47H variant had higher CSF sTREM2, p.L211P had lower CSF sTREM2 than non-carriers. We found that CSF sTREM2 increased in early symptomatic stages of late-onset AD but, unexpectedly, we observed decreased CSF sTREM2 levels at the earliest asymptomatic phase when only abnormal Aβ pathology (A+) but no tau pathology or neurodegeneration (TN-), is present.
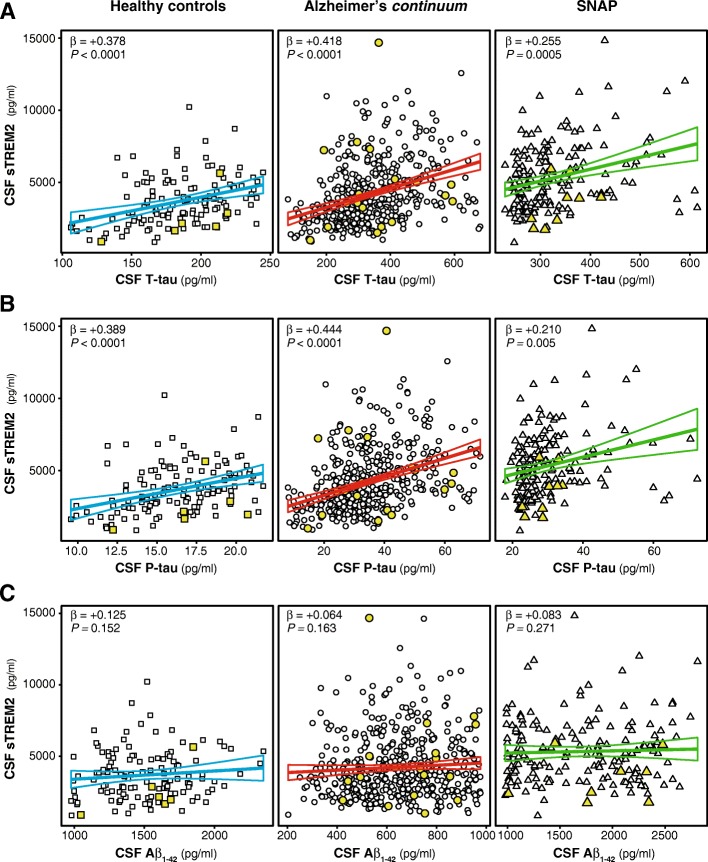
Conclusions: Aβ pathology (A) and tau pathology/neurodegeneration (TN) have differing associations with CSF sTREM2. While tau-related neurodegeneration is associated with an increase in CSF sTREM2, Aβ pathology in the absence of downstream tau-related neurodegeneration is associated with a decrease in CSF sTREM2.
Keywords: Alzheimer’s disease; Biomarkers; Microglia; Neurodegeneration; Neuroinflammation; Shedding; TREM2.
Conflict of interest statement
Ethics approval and consent to participate
The study was approved by the Ludwig-Maximilians Universität München institutional review board (IRB), as well as the IRB of all participating centers in ADNI.
Consent for publication
Not applicable.
Competing interests
CH collaborates with DENALI Therapeutics and received speakers honoraria from Novartis and Roche. KS collaborates with DENALI. JL reports to receive consulting fees from Aesku, Axon Neuroscience and Ionis Pharmaceuticals, speakers’ fees from Bayer Vital and the Willi Gross and non-financial support from Abbvie, outside the submitted work. CC receives research support from Biogen, EISAI, Alector and Parabon, and is a member of the advisory board of ADx Healthcare. The funders of the study had no role in the collection, analysis, or interpretation of data; in the writing of the report; or in the decision to submit the paper for publication. The remaining authors declare that they have no competing of interest.
Publisher’s Note
Springer Nature remains neutral with regard to jurisdictional claims in published maps and institutional affiliations.
Figures
Similar articles
-
Neuroimaging biomarkers and CSF sTREM2 levels in Alzheimer's disease: a longitudinal study.Sci Rep. 2024 Jul 3;14(1):15318. doi: 10.1038/s41598-024-66211-w. Sci Rep. 2024. PMID: 38961148 Free PMC article.
-
Dynamic changes of CSF sTREM2 in preclinical Alzheimer's disease: the CABLE study.Mol Neurodegener. 2020 Apr 10;15(1):25. doi: 10.1186/s13024-020-00374-8. Mol Neurodegener. 2020. PMID: 32276587 Free PMC article.
-
Increased cerebrospinal fluid soluble TREM2 concentration in Alzheimer's disease.Mol Neurodegener. 2016 Jan 12;11:3. doi: 10.1186/s13024-016-0071-x. Mol Neurodegener. 2016. PMID: 26754172 Free PMC article.
-
TREM2 ectodomain and its soluble form in Alzheimer's disease.J Neuroinflammation. 2020 Jul 7;17(1):204. doi: 10.1186/s12974-020-01878-2. J Neuroinflammation. 2020. PMID: 32635934 Free PMC article. Review.
-
Does Soluble TREM2 Protect Against Alzheimer's Disease?Front Aging Neurosci. 2022 Jan 28;13:834697. doi: 10.3389/fnagi.2021.834697. eCollection 2021. Front Aging Neurosci. 2022. PMID: 35153729 Free PMC article. Review.
Cited by
-
Cerebral amyloid-β load is associated with neurodegeneration and gliosis: Mediation by p-tau and interactions with risk factors early in the Alzheimer's continuum.Alzheimers Dement. 2021 May;17(5):788-800. doi: 10.1002/alz.12245. Epub 2021 Mar 4. Alzheimers Dement. 2021. PMID: 33663013 Free PMC article.
-
Pathogenesis, therapeutic strategies and biomarker development based on "omics" analysis related to microglia in Alzheimer's disease.J Neuroinflammation. 2022 Sep 4;19(1):215. doi: 10.1186/s12974-022-02580-1. J Neuroinflammation. 2022. PMID: 36058959 Free PMC article. Review.
-
Cross-Talk and Subset Control of Microglia and Associated Myeloid Cells in Neurological Disorders.Cells. 2022 Oct 25;11(21):3364. doi: 10.3390/cells11213364. Cells. 2022. PMID: 36359758 Free PMC article. Review.
-
CSF glial biomarkers are associated with cognition in individuals at risk of Alzheimer's disease.Alzheimers Dement. 2024 Sep;20(9):5819-5832. doi: 10.1002/alz.13862. Epub 2024 Jul 19. Alzheimers Dement. 2024. PMID: 39032119 Free PMC article.
-
Advances and considerations in AD tau-targeted immunotherapy.Neurobiol Dis. 2020 Feb;134:104707. doi: 10.1016/j.nbd.2019.104707. Epub 2019 Dec 10. Neurobiol Dis. 2020. PMID: 31841678 Free PMC article. Review.
References
Publication types
MeSH terms
Substances
Grants and funding
LinkOut - more resources
Full Text Sources
Other Literature Sources
Medical
