

MicroCT imaging reveals differential 3D micro-scale remodelling of the murine aorta in ageing and Marfan syndrome
- PMID: 30613281
- PMCID: PMC6299435
- DOI: 10.7150/thno.26598
MicroCT imaging reveals differential 3D micro-scale remodelling of the murine aorta in ageing and Marfan syndrome
Abstract
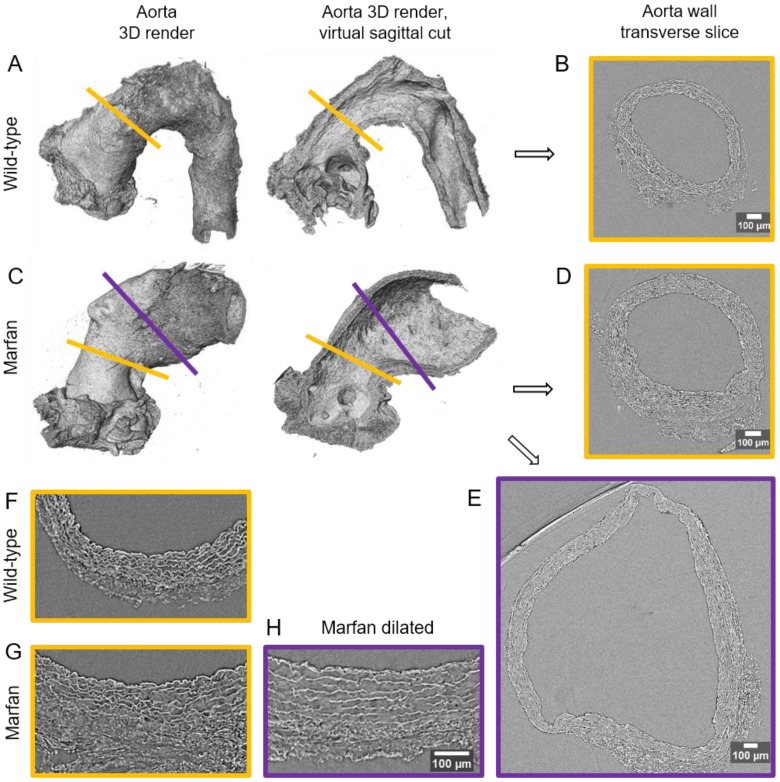
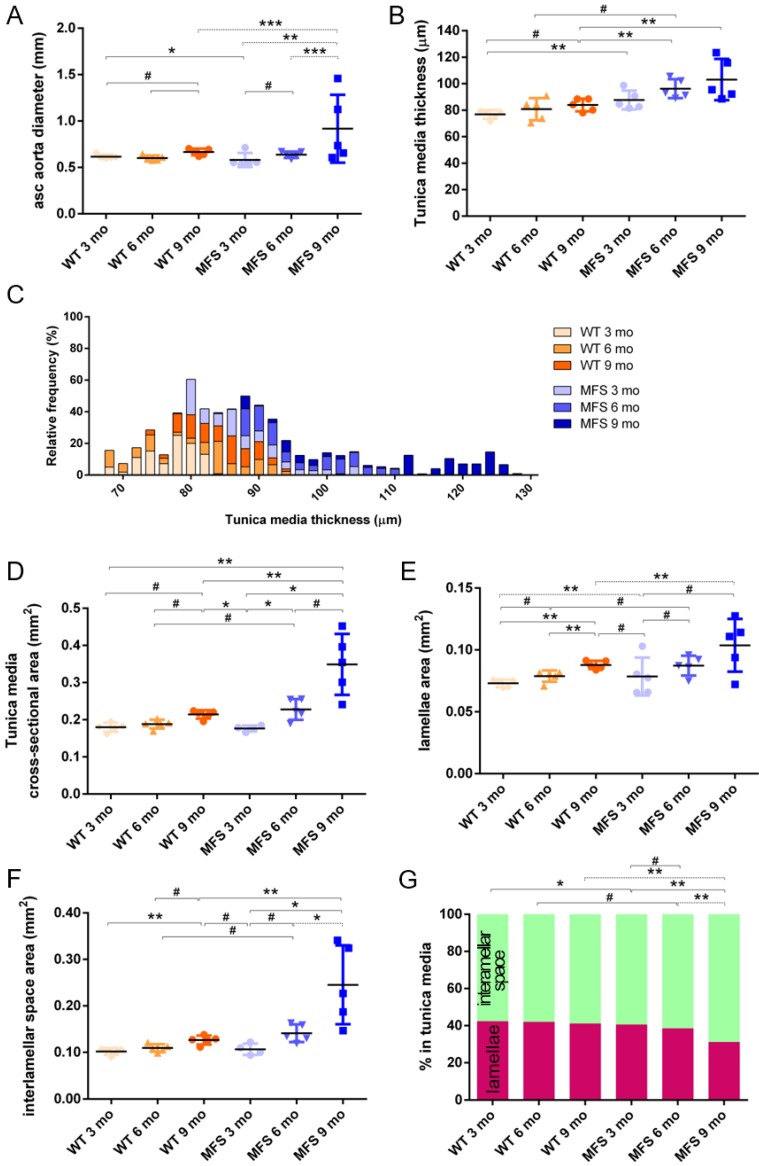
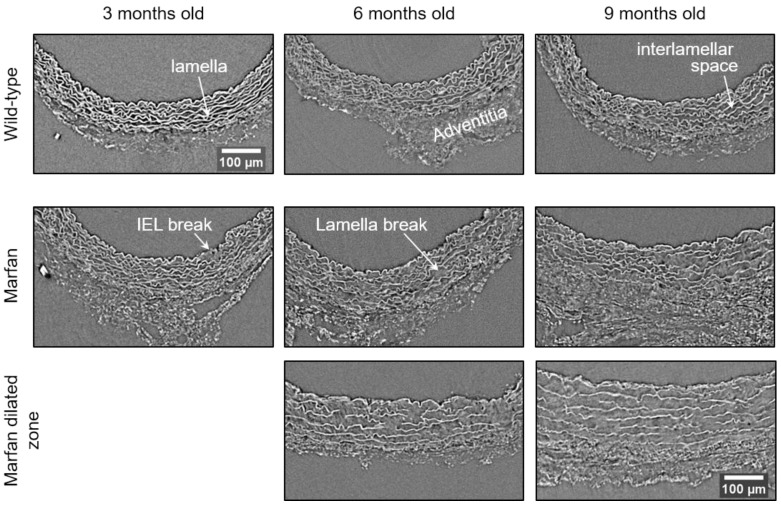
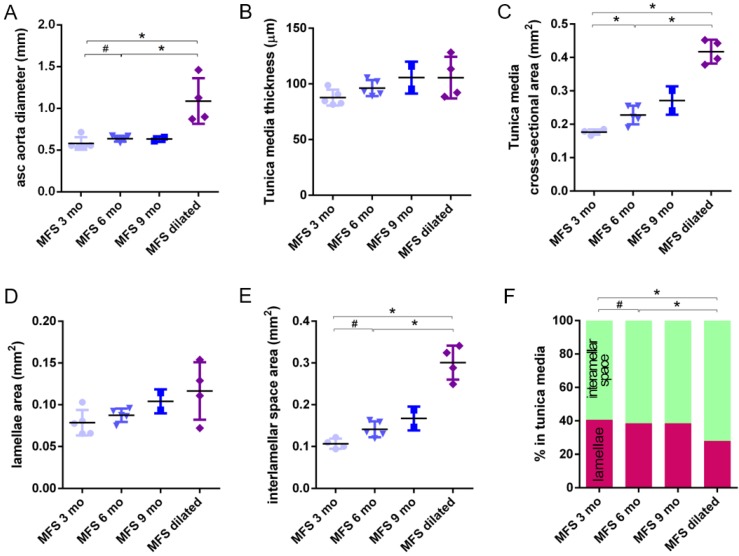
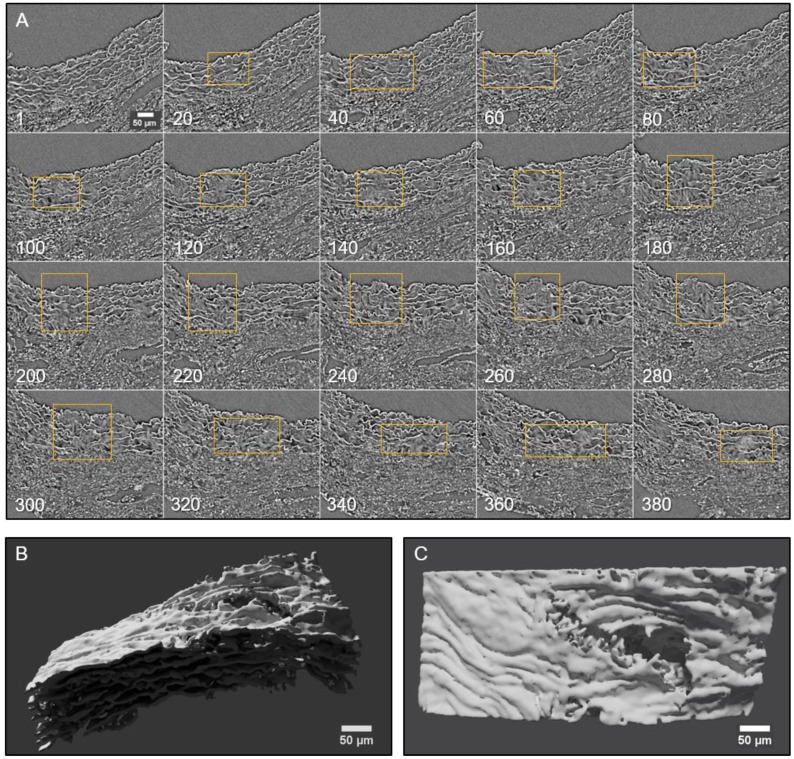
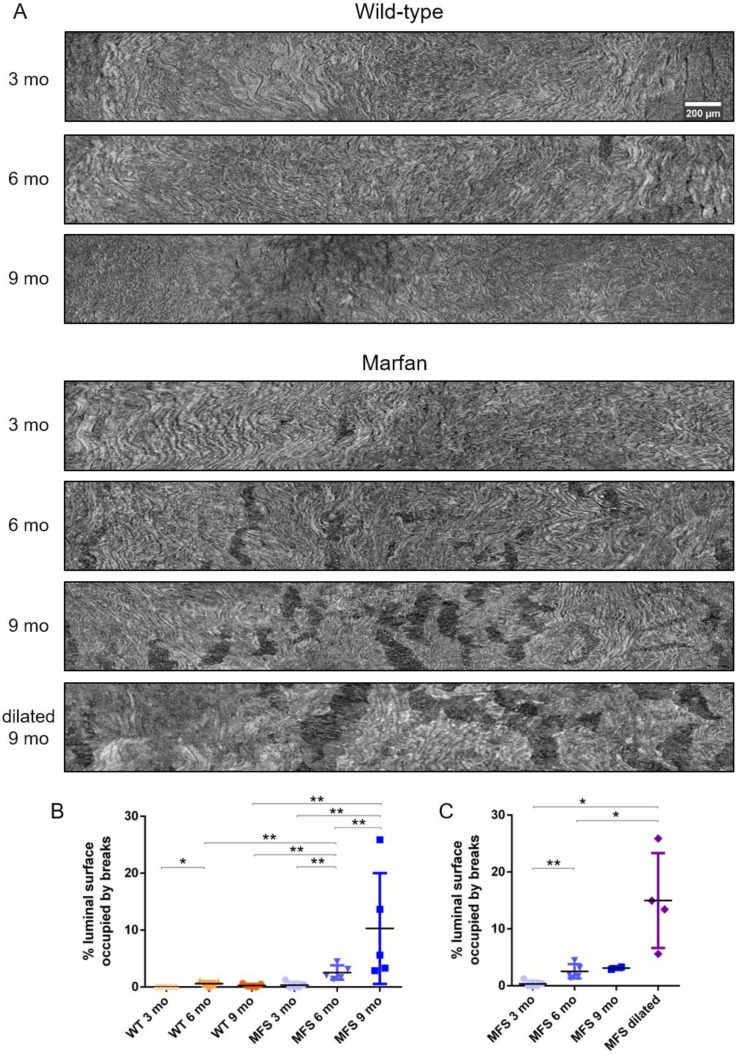
Aortic wall remodelling is a key feature of both ageing and genetic connective tissue diseases, which are associated with vasculopathies such as Marfan syndrome (MFS). Although the aorta is a 3D structure, little attention has been paid to volumetric assessment, primarily due to the limitations of conventional imaging techniques. Phase-contrast microCT is an emerging imaging technique, which is able to resolve the 3D micro-scale structure of large samples without the need for staining or sectioning. Methods: Here, we have used synchrotron-based phase-contrast microCT to image aortae of wild type (WT) and MFS Fbn1C1039G/+ mice aged 3, 6 and 9 months old (n=5). We have also developed a new computational approach to automatically measure key histological parameters. Results: This analysis revealed that WT mice undergo age-dependent aortic remodelling characterised by increases in ascending aorta diameter, tunica media thickness and cross-sectional area. The MFS aortic wall was subject to comparable remodelling, but the magnitudes of the changes were significantly exacerbated, particularly in 9 month-old MFS mice with ascending aorta wall dilations. Moreover, this morphological remodelling in MFS aorta included internal elastic lamina surface breaks that extended throughout the MFS ascending aorta and were already evident in animals who had not yet developed aneurysms. Conclusions: Our 3D microCT study of the sub-micron wall structure of whole, intact aorta reveals that histological remodelling of the tunica media in MFS could be viewed as an accelerated ageing process, and that phase-contrast microCT combined with computational image analysis allows the visualisation and quantification of 3D morphological remodelling in large volumes of unstained vascular tissues.
Keywords: Marfan syndrome; ageing; aorta; elastic lamella; microCT.
Conflict of interest statement
Competing Interests: The authors have declared that no competing interest exists.
Figures

Similar articles
-
High-Resolution Morphological Approach to Analyse Elastic Laminae Injuries of the Ascending Aorta in a Murine Model of Marfan Syndrome.Sci Rep. 2017 May 4;7(1):1505. doi: 10.1038/s41598-017-01620-8. Sci Rep. 2017. PMID: 28473723 Free PMC article.
-
Redox stress in Marfan syndrome: Dissecting the role of the NADPH oxidase NOX4 in aortic aneurysm.Free Radic Biol Med. 2018 Apr;118:44-58. doi: 10.1016/j.freeradbiomed.2018.02.023. Epub 2018 Feb 20. Free Radic Biol Med. 2018. PMID: 29471108
-
Differences in the Thoracic Aorta by Region and Sex in a Murine Model of Marfan Syndrome.Front Physiol. 2017 Nov 15;8:933. doi: 10.3389/fphys.2017.00933. eCollection 2017. Front Physiol. 2017. PMID: 29187826 Free PMC article.
-
Cardiovascular characteristics in Marfan syndrome and their relation to the genotype.Verh K Acad Geneeskd Belg. 2009;71(6):335-71. Verh K Acad Geneeskd Belg. 2009. PMID: 20232788 Review.
-
Vascular smooth muscle cells in Marfan syndrome aneurysm: the broken bricks in the aortic wall.Cell Mol Life Sci. 2017 Jan;74(2):267-277. doi: 10.1007/s00018-016-2324-9. Epub 2016 Aug 17. Cell Mol Life Sci. 2017. PMID: 27535662 Free PMC article. Review.
Cited by
-
X-ray Micro-Computed Tomography: An Emerging Technology to Analyze Vascular Calcification in Animal Models.Int J Mol Sci. 2020 Jun 25;21(12):4538. doi: 10.3390/ijms21124538. Int J Mol Sci. 2020. PMID: 32630604 Free PMC article. Review.
-
Early Alterations of Intra-Mural Elastic Lamellae Revealed by Synchrotron X-ray Micro-CT Exploration of Diabetic Aortas.Int J Mol Sci. 2022 Mar 17;23(6):3250. doi: 10.3390/ijms23063250. Int J Mol Sci. 2022. PMID: 35328674 Free PMC article.
-
Progressive Microstructural Deterioration Dictates Evolving Biomechanical Dysfunction in the Marfan Aorta.Front Cardiovasc Med. 2021 Dec 16;8:800730. doi: 10.3389/fcvm.2021.800730. eCollection 2021. Front Cardiovasc Med. 2021. PMID: 34977201 Free PMC article.
-
A Review of Ex Vivo X-ray Microfocus Computed Tomography-Based Characterization of the Cardiovascular System.Int J Mol Sci. 2021 Mar 23;22(6):3263. doi: 10.3390/ijms22063263. Int J Mol Sci. 2021. PMID: 33806852 Free PMC article. Review.
References
-
- Robertson AM, Watton PN. Mechanobiology of the arterial wall. In: Becker S, Kuznetsov A, editors. Transport in Biological Media. 1st ed. Elsevier; 2013. pp. 275–7.
-
- Dietz HC, Loeys B, Carta L, Ramirez F. Recent progress towards a molecular understanding of Marfan syndrome. Am J Genet Part C Sem Med Gent. 2005;139C:4–9. - PubMed
