Common ELF1 deletion in prostate cancer bolsters oncogenic ETS function, inhibits senescence and promotes docetaxel resistance
- PMID: 30603056
- PMCID: PMC6305106
- DOI: 10.18632/genesandcancer.182
Common ELF1 deletion in prostate cancer bolsters oncogenic ETS function, inhibits senescence and promotes docetaxel resistance
Abstract
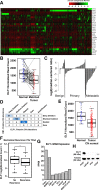
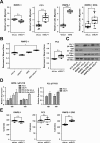
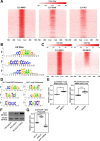
ETS family transcription factors play major roles in prostate tumorigenesis with some acting as oncogenes and others as tumor suppressors. ETS factors can compete for binding at some cis-regulatory sequences, but display specific binding at others. Therefore, changes in expression of ETS family members during tumorigenesis can have complex, multimodal effects. Here we show that ELF1 was the most commonly down-regulated ETS factor in primary prostate tumors, and expression decreased further in metastatic disease. Genome-wide mapping in cell lines indicated that ELF1 has two distinct tumor suppressive roles mediated by distinct cis-regulatory sequences. First, ELF1 inhibited cell migration and epithelial-mesenchymal transition by interfering with oncogenic ETS functions at ETS/AP-1 cis-regulatory motifs. Second, ELF1 uniquely targeted and activated genes that promote senescence. Furthermore, knockdown of ELF1 increased docetaxel resistance, indicating that the genomic deletions found in metastatic prostate tumors may promote therapeutic resistance through loss of both RB1 and ELF1.
Keywords: ELF1; ETS; chemotherapy resistance; prostate cancer; tumor suppressor.
Conflict of interest statement
CONFLICTS OF INTEREST None
Figures


Similar articles
-
Expression of ELF1, a lymphoid ETS domain-containing transcription factor, is recurrently lost in classical Hodgkin lymphoma.Br J Haematol. 2019 Apr;185(1):79-88. doi: 10.1111/bjh.15757. Epub 2019 Jan 25. Br J Haematol. 2019. PMID: 30681722
-
E74-like ETS transcription factor 1 promotes the progression of pancreatic cancer by regulating doublecortin-like kinase 1/Janus kinase/signal transducer and activator of transcription pathway.Am J Cancer Res. 2024 Feb 15;14(2):616-629. doi: 10.62347/TEWF1767. eCollection 2024. Am J Cancer Res. 2024. PMID: 38455425 Free PMC article.
-
Suppression of CHK1 by ETS Family Members Promotes DNA Damage Response Bypass and Tumorigenesis.Cancer Discov. 2015 May;5(5):550-63. doi: 10.1158/2159-8290.CD-13-1050. Epub 2015 Feb 4. Cancer Discov. 2015. PMID: 25653093 Free PMC article.
-
ETS transcription factors: oncogenes and tumor suppressor genes as therapeutic targets for prostate cancer.Expert Rev Anticancer Ther. 2008 Jan;8(1):33-42. doi: 10.1586/14737140.8.1.33. Expert Rev Anticancer Ther. 2008. PMID: 18095881 Review.
-
Oncogenic ETS Factors in Prostate Cancer.Adv Exp Med Biol. 2019;1210:409-436. doi: 10.1007/978-3-030-32656-2_18. Adv Exp Med Biol. 2019. PMID: 31900919 Review.
Cited by
-
Biomarker Identification through Multiomics Data Analysis of Prostate Cancer Prognostication Using a Deep Learning Model and Similarity Network Fusion.Cancers (Basel). 2021 May 21;13(11):2528. doi: 10.3390/cancers13112528. Cancers (Basel). 2021. PMID: 34064004 Free PMC article.
-
Escape From Cisplatin-Induced Senescence of Hypoxic Lung Cancer Cells Can Be Overcome by Hydroxychloroquine.Front Oncol. 2022 Jan 21;11:738385. doi: 10.3389/fonc.2021.738385. eCollection 2021. Front Oncol. 2022. PMID: 35127467 Free PMC article.
-
Comprehensive analysis of E47‑like factors and verification of ELF4 in clear cell renal cell carcinoma.Oncol Lett. 2023 Jul 27;26(3):395. doi: 10.3892/ol.2023.13981. eCollection 2023 Sep. Oncol Lett. 2023. PMID: 37600328 Free PMC article.
-
Mapping the unicellular transcriptome of the ascending thoracic aorta to changes in mechanosensing and mechanoadaptation during aging.Aging Cell. 2024 Aug;23(8):e14197. doi: 10.1111/acel.14197. Epub 2024 Jun 2. Aging Cell. 2024. PMID: 38825882 Free PMC article.
-
High ELF4 expression in human cancers is associated with worse disease outcomes and increased resistance to anticancer drugs.PLoS One. 2021 Apr 9;16(4):e0248984. doi: 10.1371/journal.pone.0248984. eCollection 2021. PLoS One. 2021. PMID: 33836003 Free PMC article.
References
-
- Tomlins SA, Rhodes DR, Perner S, Dhanasekaran SM, Mehra R, Sun XW, Varambally S, Cao X, Tchinda J, Kuefer R, Lee C, Montie JE, Shah RB, et al. Recurrent fusion of TMPRSS2 and ETS transcription factor genes in prostate cancer. Science. 2005;310:644–8. - PubMed
-
- Tomlins SA, Laxman B, Dhanasekaran SM, Helgeson BE, Cao X, Morris DS, Menon A, Jing X, Cao Q, Han B, Yu J, Wang L, Montie JE, et al. Distinct classes of chromosomal rearrangements create oncogenic ETS gene fusions in prostate cancer. Nature. 2007;448:595–9. - PubMed
-
- Aytes A, Mitrofanova A, Kinkade CW, Lefebvre C, Lei M, Phelan V, LeKaye HC, Koutcher JA, Cardiff RD, Califano A, Shen MM, Abate-Shen C. ETV4 promotes metastasis in response to activation of PI3-kinase and Ras signaling in a mouse model of advanced prostate cancer. Proc Natl Acad Sci U S A. 2013;110:E3506–15. doi: 10.1073/pnas.1303558110. - DOI - PMC - PubMed
Grants and funding
LinkOut - more resources
Full Text Sources
Other Literature Sources
Molecular Biology Databases
Research Materials
Miscellaneous

