Disrupted filamin A/αIIbβ3 interaction induces macrothrombocytopenia by increasing RhoA activity
- PMID: 30602618
- PMCID: PMC6484462
- DOI: 10.1182/blood-2018-07-861427
Disrupted filamin A/αIIbβ3 interaction induces macrothrombocytopenia by increasing RhoA activity
Abstract
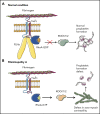
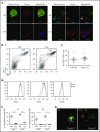
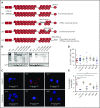
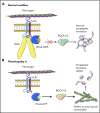
Filamin A (FLNa) links the cell membrane with the cytoskeleton and is central in several cellular processes. Heterozygous mutations in the X-linked FLNA gene are associated with a large spectrum of conditions, including macrothrombocytopenia, called filaminopathies. Using an isogenic pluripotent stem cell model derived from patients, we show that the absence of the FLNa protein in megakaryocytes (MKs) leads to their incomplete maturation, particularly the inability to produce proplatelets. Reduction in proplatelet formation potential is associated with a defect in actomyosin contractility, which results from inappropriate RhoA activation. This dysregulated RhoA activation was observed when MKs were plated on fibrinogen but not on other matrices (fibronectin, vitronectin, collagen 1, and von Willebrand factor), strongly suggesting a role for FLNa/αIIbβ3 interaction in the downregulation of RhoA activity. This was confirmed by experiments based on the overexpression of FLNa mutants deleted in the αIIbβ3-binding domain and the RhoA-interacting domain, respectively. Finally, pharmacological inhibition of the RhoA-associated kinase ROCK1/2 restored a normal phenotype and proplatelet formation. Overall, this work suggests a new etiology for macrothrombocytopenia, in which increased RhoA activity is associated with disrupted FLNa/αIIbβ3 interaction.
© 2019 by The American Society of Hematology.
Conflict of interest statement
Conflict-of-interest disclosure: The authors declare no competing financial interests.
Figures


Comment in
-
αIIbβ3 changes gears in MKs and platelets.Blood. 2019 Apr 18;133(16):1700-1701. doi: 10.1182/blood-2019-01-896092. Blood. 2019. PMID: 31000515 No abstract available.
Similar articles
-
Gain-of-Function Mutation in Filamin A Potentiates Platelet Integrin αIIbβ3 Activation.Arterioscler Thromb Vasc Biol. 2017 Jun;37(6):1087-1097. doi: 10.1161/ATVBAHA.117.309337. Epub 2017 Apr 20. Arterioscler Thromb Vasc Biol. 2017. PMID: 28428218
-
A nonsynonymous SNP in the ITGB3 gene disrupts the conserved membrane-proximal cytoplasmic salt bridge in the alphaIIbbeta3 integrin and cosegregates dominantly with abnormal proplatelet formation and macrothrombocytopenia.Blood. 2008 Apr 1;111(7):3407-14. doi: 10.1182/blood-2007-09-112615. Epub 2007 Dec 7. Blood. 2008. PMID: 18065693
-
Filamin A: key actor in platelet biology.Blood. 2019 Oct 17;134(16):1279-1288. doi: 10.1182/blood.2019000014. Blood. 2019. PMID: 31471375 Review.
-
Opposing FlnA and FlnB interactions regulate RhoA activation in guiding dynamic actin stress fiber formation and cell spreading.Hum Mol Genet. 2017 Apr 1;26(7):1294-1304. doi: 10.1093/hmg/ddx047. Hum Mol Genet. 2017. PMID: 28175289 Free PMC article.
-
FilGAP and its close relatives: a mediator of Rho-Rac antagonism that regulates cell morphology and migration.Biochem J. 2013 Jul 1;453(1):17-25. doi: 10.1042/BJ20130290. Biochem J. 2013. PMID: 23763313 Review.
Cited by
-
A mechanism of platelet integrin αIIbβ3 outside-in signaling through a novel integrin αIIb subunit-filamin-actin linkage.Blood. 2023 May 25;141(21):2629-2641. doi: 10.1182/blood.2022018333. Blood. 2023. PMID: 36867840 Free PMC article.
-
Inherited thrombocytopenias: history, advances and perspectives.Haematologica. 2020 Aug;105(8):2004-2019. doi: 10.3324/haematol.2019.233197. Epub 2020 Jun 11. Haematologica. 2020. PMID: 32527953 Free PMC article. Review.
-
Role of Rho-GTPases in megakaryopoiesis.Small GTPases. 2021 Sep-Nov;12(5-6):399-415. doi: 10.1080/21541248.2021.1885134. Epub 2021 Feb 11. Small GTPases. 2021. PMID: 33570449 Free PMC article. Review.
-
The Pediatric Acute Leukemia Fusion Oncogene ETO2-GLIS2 Increases Self-Renewal and Alters Differentiation in a Human Induced Pluripotent Stem Cells-Derived Model.Hemasphere. 2020 Jan 22;4(1):e319. doi: 10.1097/HS9.0000000000000319. eCollection 2020 Feb. Hemasphere. 2020. PMID: 32072139 Free PMC article.
-
Molecular Tuning of Filamin A Activities in the Context of Adhesion and Migration.Front Cell Dev Biol. 2020 Nov 20;8:591323. doi: 10.3389/fcell.2020.591323. eCollection 2020. Front Cell Dev Biol. 2020. PMID: 33330471 Free PMC article. Review.
References
-
- Zhou AX, Hartwig JH, Akyürek LM. Filamins in cell signaling, transcription and organ development. Trends Cell Biol. 2010;20(2):113-123. - PubMed
-
- Feng Y, Walsh CA. The many faces of filamin: a versatile molecular scaffold for cell motility and signalling. Nat Cell Biol. 2004;6(11):1034-1038. - PubMed
-
- Parrini E, Ramazzotti A, Dobyns WB, et al. . Periventricular heterotopia: phenotypic heterogeneity and correlation with filamin A mutations. Brain. 2006;129(Pt 7):1892-1906. - PubMed
Publication types
MeSH terms
Substances
LinkOut - more resources
Full Text Sources
Miscellaneous

