

TNF-alpha and metalloproteases as key players in melanoma cells aggressiveness
- PMID: 30591049
- PMCID: PMC6309098
- DOI: 10.1186/s13046-018-0982-1
TNF-alpha and metalloproteases as key players in melanoma cells aggressiveness
Abstract
Background: Melanoma aggressiveness determines its growth and metastatic potential. This study aimed at identifying new molecular pathways controlling melanoma cell malignancy.
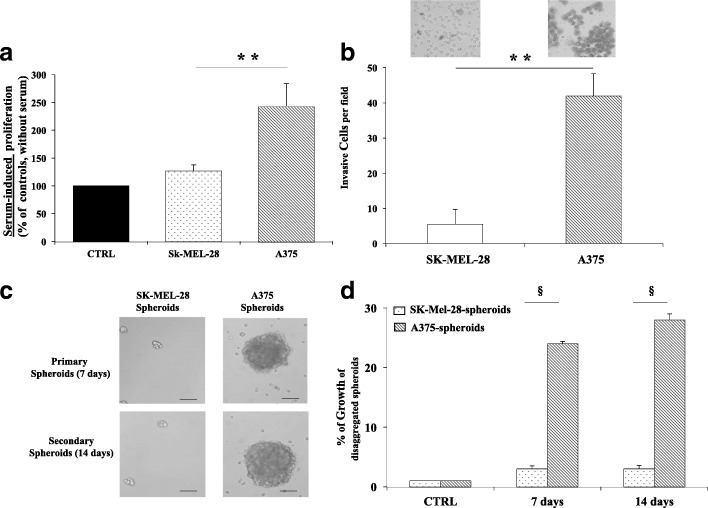
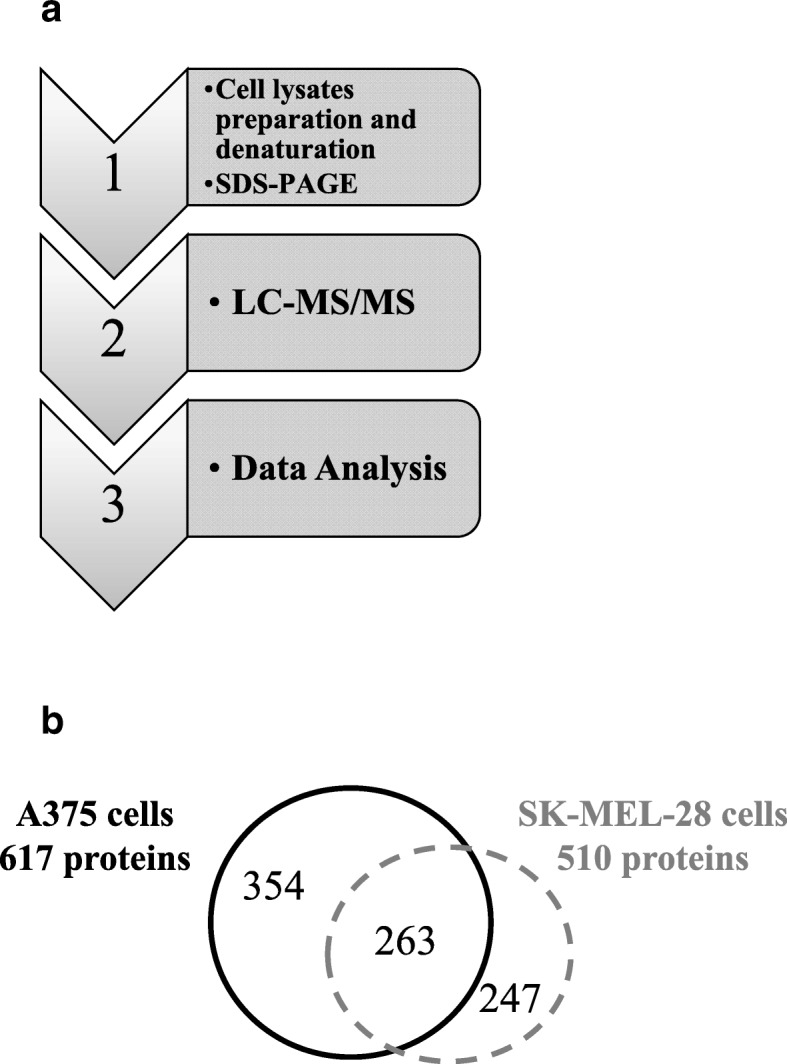
Methods: Ten metastatic melanoma cell lines were characterized by their proliferation, migration and invasion capabilities. The most representative cells were also characterized by spheroid formation assay, gene- and protein- expression profiling as well as cytokines secretion and the most relevant pathways identified through bioinformatic analysis were tested by in silico transcriptomic validation on datasets generated from biopsies specimens of melanoma patients. Further, matrix metalloproteases (MMPs) activity was tested by zymography assays and TNF-alpha role was validated by anti-TNF cell-treatment.
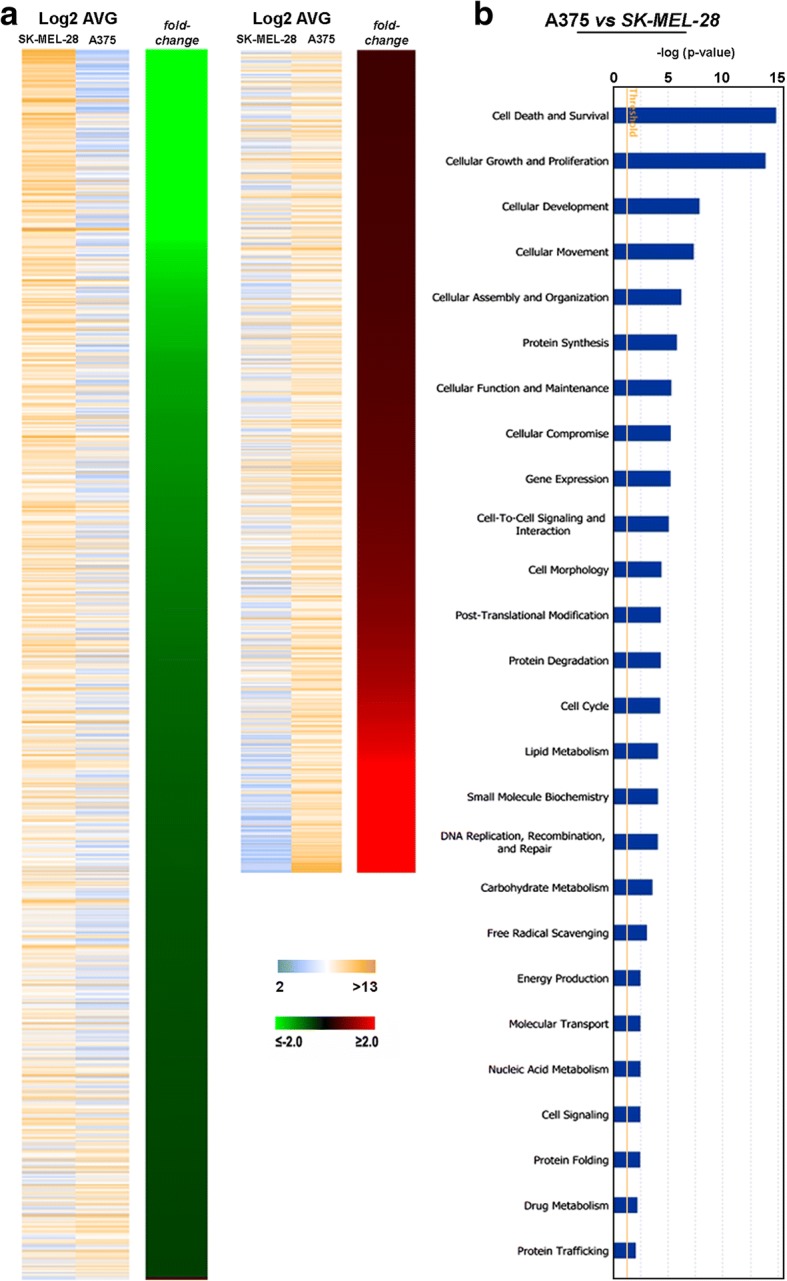
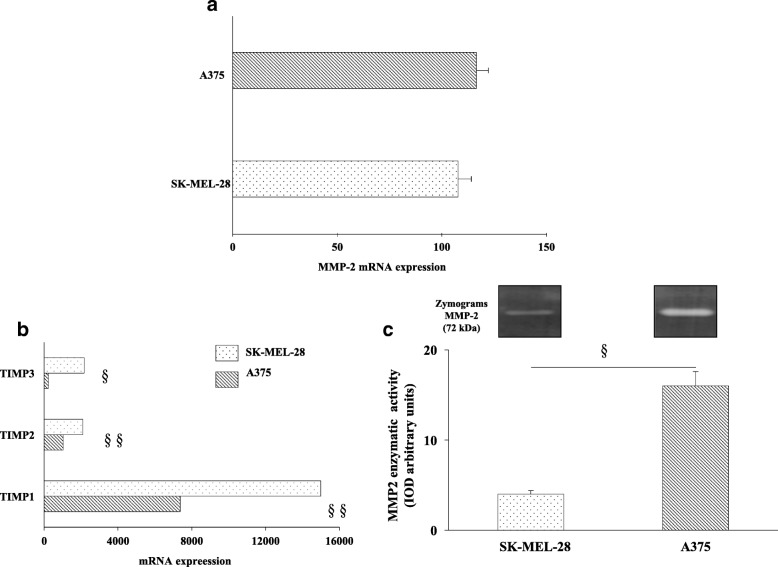
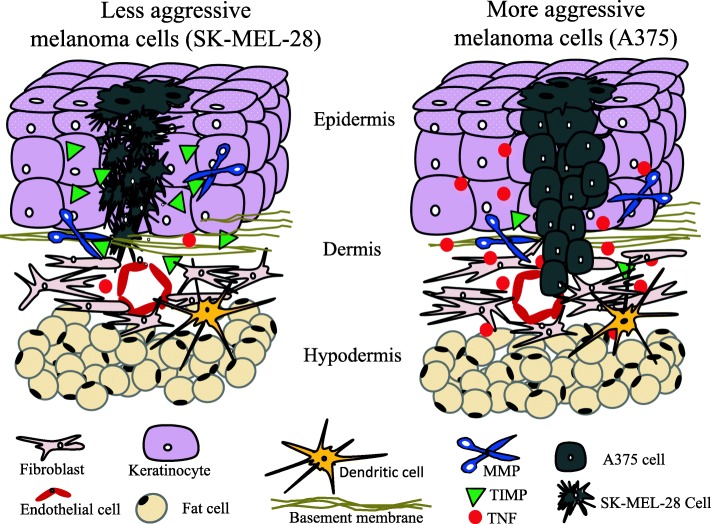
Results: An aggressiveness score (here named Melanoma AGgressiveness Score: MAGS) was calculated by measuring proliferation, migration, invasion and cell-doubling time in10human melanoma cell lines which were clustered in two distinct groups, according to the corresponding MAGS. SK-MEL-28 and A375 cell lines were selected as representative models for the less and the most aggressive phenotype, respectively. Gene-expression and protein expression data were collected for SK-MEL-28 and A375 cells by Illumina-, multiplex x-MAP-and mass-spectrometry technology. The collected data were subjected to an integrated Ingenuity Pathway Analysis, which highlighted that cytokine/chemokine secretion, as well as Cell-To-Cell Signaling and Interaction functions as well as matrix metalloproteases activity were significantly different in these two cell types. The key role of these pathways was then confirmed by functional validation. TNF role was confirmed by exposing cells to the anti-TNF Infliximab antibody. Upon such treatment melanoma cells aggressiveness was strongly reduced. Metalloproteases activity was assayed, and their role was confirmed by comparing transcriptomic data from cutaneous melanoma patients (n = 45) and benign nevi (n = 18).
Conclusions: Inflammatory signals such as TNF and MMP-2 activity are key intrinsic players to determine melanoma cells aggressiveness suggesting new venue sin the identification of novel molecular targets with potential therapeutic relevance.
Keywords: Cancer; Cutaneous melanoma; Cytokines; Inflammation; Malignancy; Metalloproteases; Proteomics; TNF; Uveal melanoma.
Conflict of interest statement
Ethics approval and consent to participate
The study does not contain experiments with animal models.
No human tissues have been used. Data regarding human datasets of melanoma patients are from a dataset available online at the GEO database (
Consent for publication
All Authors have approved the manuscript and agree with submission to Journal of Experimental and Clinical Cancer Research.
Competing interests
The Authors declare that they have no competing interests.
Publisher’s Note
Springer Nature remains neutral with regard to jurisdictional claims in published maps and institutional affiliations.
Figures


Similar articles
-
Gallic acid inhibits the migration and invasion of A375.S2 human melanoma cells through the inhibition of matrix metalloproteinase-2 and Ras.Melanoma Res. 2011 Aug;21(4):267-73. doi: 10.1097/CMR.0b013e3283414444. Melanoma Res. 2011. PMID: 21734530
-
Theophylline induces differentiation and modulates cytoskeleton dynamics and cytokines secretion in human melanoma-initiating cells.Life Sci. 2019 Aug 1;230:121-131. doi: 10.1016/j.lfs.2019.05.050. Epub 2019 May 21. Life Sci. 2019. PMID: 31125565
-
Rictor regulates the vasculogenic mimicry of melanoma via the AKT-MMP-2/9 pathway.J Cell Mol Med. 2017 Dec;21(12):3579-3591. doi: 10.1111/jcmm.13268. Epub 2017 Jul 12. J Cell Mol Med. 2017. PMID: 28699701 Free PMC article.
-
Metalloproteinases: a Functional Pathway for Myeloid Cells.Microbiol Spectr. 2016 Apr;4(2):10.1128/microbiolspec.MCHD-0002-2015. doi: 10.1128/microbiolspec.MCHD-0002-2015. Microbiol Spectr. 2016. PMID: 27227311 Free PMC article. Review.
-
The zinc metallopeptidase family: new faces, new functions.Protein Pept Lett. 2004 Oct;11(5):407-14. doi: 10.2174/0929866043406481. Protein Pept Lett. 2004. PMID: 15544561 Review. No abstract available.
Cited by
-
Significance of Tumor Mutation Burden in Immune Infiltration and Prognosis in Cutaneous Melanoma.Front Oncol. 2020 Sep 18;10:573141. doi: 10.3389/fonc.2020.573141. eCollection 2020. Front Oncol. 2020. PMID: 33072607 Free PMC article.
-
Development of a TNF-α-mediated Trojan Horse for bacteria-based cancer therapy.Mol Ther. 2022 Jul 6;30(7):2522-2536. doi: 10.1016/j.ymthe.2022.04.008. Epub 2022 Apr 18. Mol Ther. 2022. PMID: 35440418 Free PMC article.
-
Novel N-Substituted Amino Acid Hydrazone-Isatin Derivatives: Synthesis, Antioxidant Activity, and Anticancer Activity in 2D and 3D Models In Vitro.Int J Mol Sci. 2021 Jul 21;22(15):7799. doi: 10.3390/ijms22157799. Int J Mol Sci. 2021. PMID: 34360565 Free PMC article.
-
CA-IX-Expressing Small Extracellular Vesicles (sEVs) Are Released by Melanoma Cells under Hypoxia and in the Blood of Advanced Melanoma Patients.Int J Mol Sci. 2023 Mar 24;24(7):6122. doi: 10.3390/ijms24076122. Int J Mol Sci. 2023. PMID: 37047096 Free PMC article.
-
Effects of the IL6 -174G>C promoter polymorphism and IL-6 serum levels on the progression of cutaneous malignant melanoma.Oncol Lett. 2020 Aug;20(2):1781-1791. doi: 10.3892/ol.2020.11740. Epub 2020 Jun 16. Oncol Lett. 2020. PMID: 32724421 Free PMC article.
References
-
- Matthews NH, Li W-Q, Qureshi AA, Weinstock MA, Cho E. Epidemiology of Melanoma. Cutan Melanoma Etiol Ther. 2017; Section 1, Chapter 1, p.3–22.
-
- Hendrix MJC, Seftor EA, Margaryan N V, Seftor REB. Heterogeneity and Plasticity of Melanoma: Challenges of Current Therapies. Cutan. Melanoma Etiol. Ther. 2017. Section 1, Chapter 4, p.57–66. - PubMed
MeSH terms
Substances
Grants and funding
LinkOut - more resources
Full Text Sources
Other Literature Sources
Medical
Miscellaneous
