. 2019 May 1;316(5):C698-C710.
doi: 10.1152/ajpcell.00327.2018. Epub 2018 Dec 19.

Properties of single-channel and whole cell Cl- currents in guinea pig detrusor smooth muscle cells

Affiliations

Properties of single-channel and whole cell Cl- currents in guinea pig detrusor smooth muscle cells

Viktor Yarotskyy et al. Am J Physiol Cell Physiol. .

Abstract

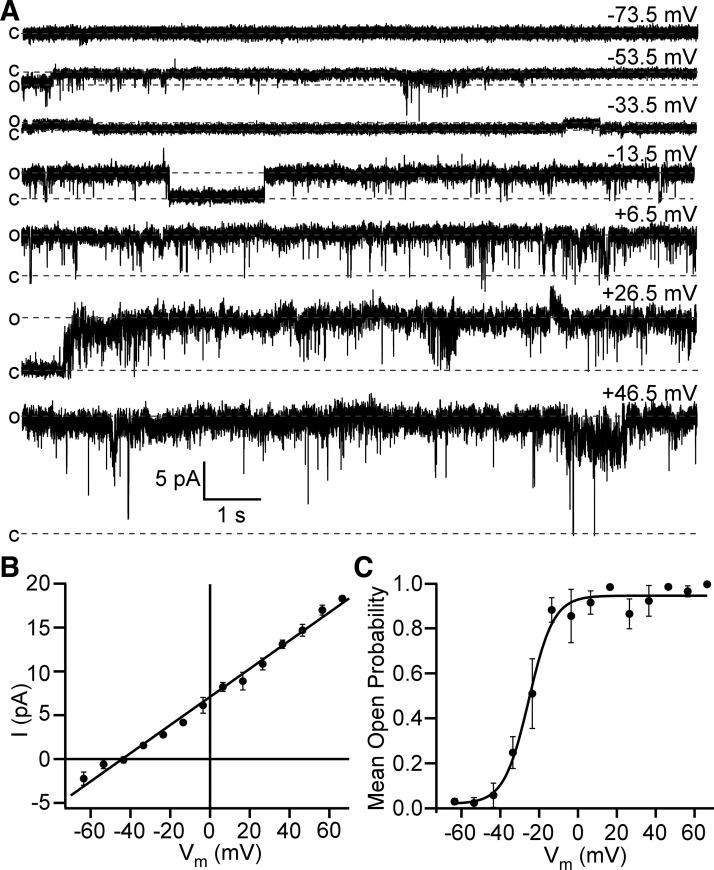
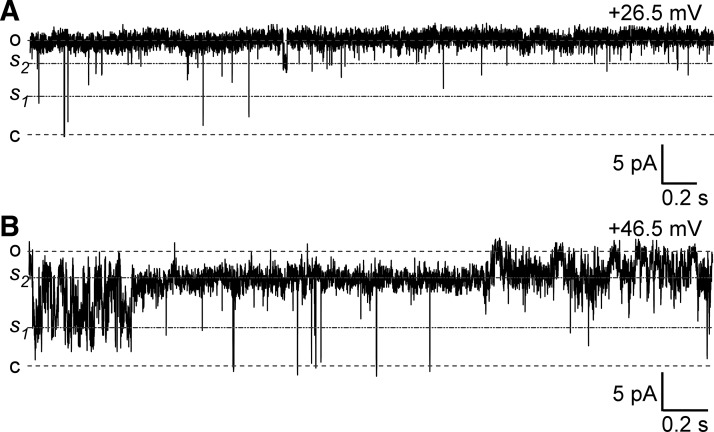
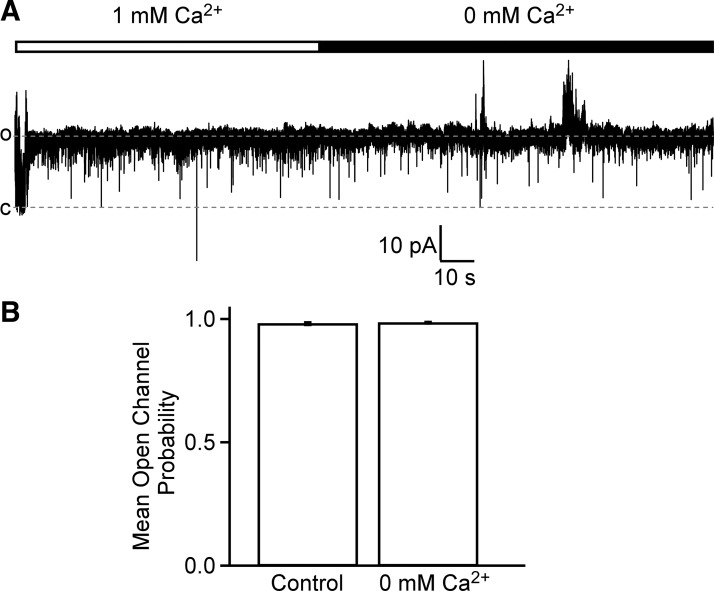
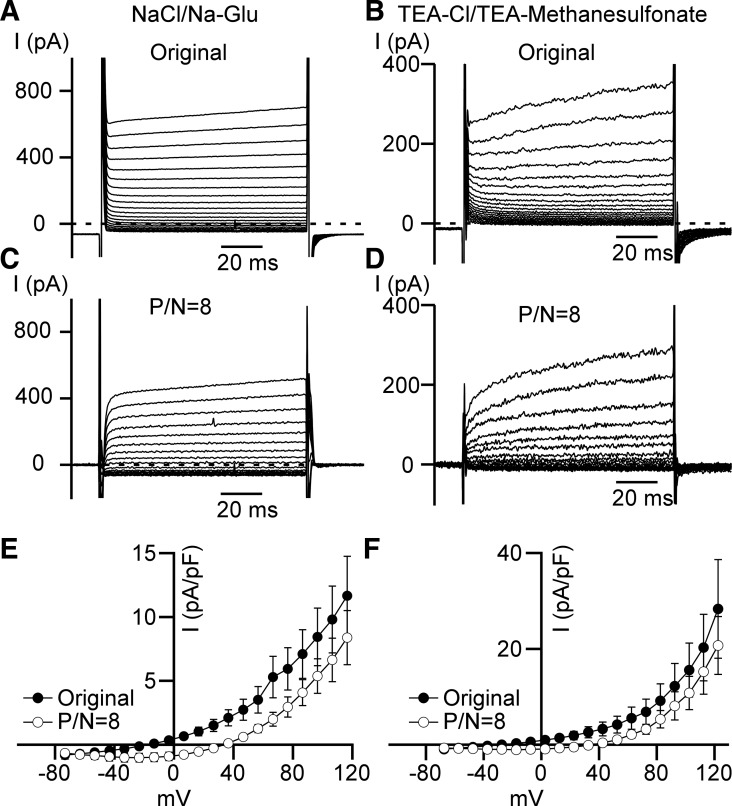
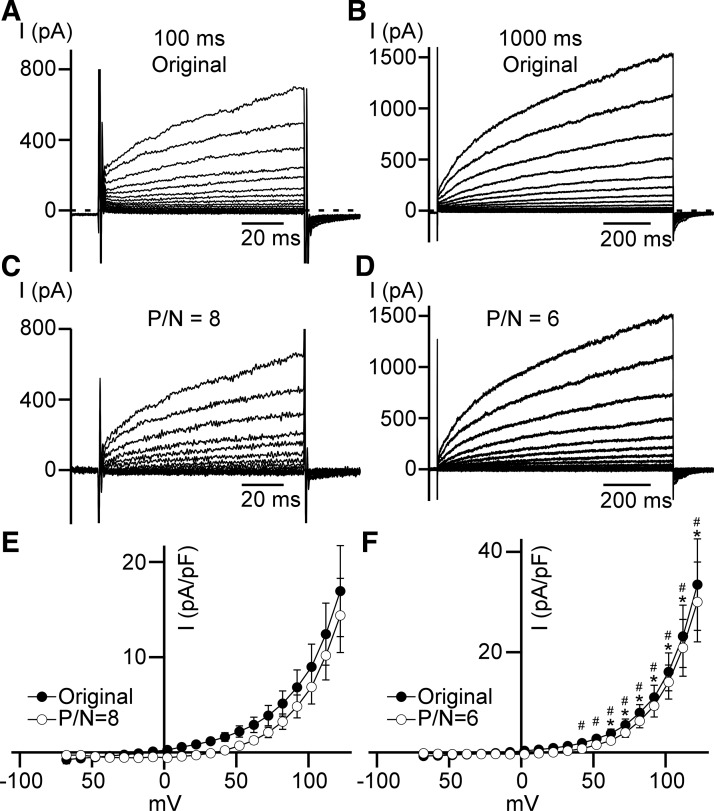
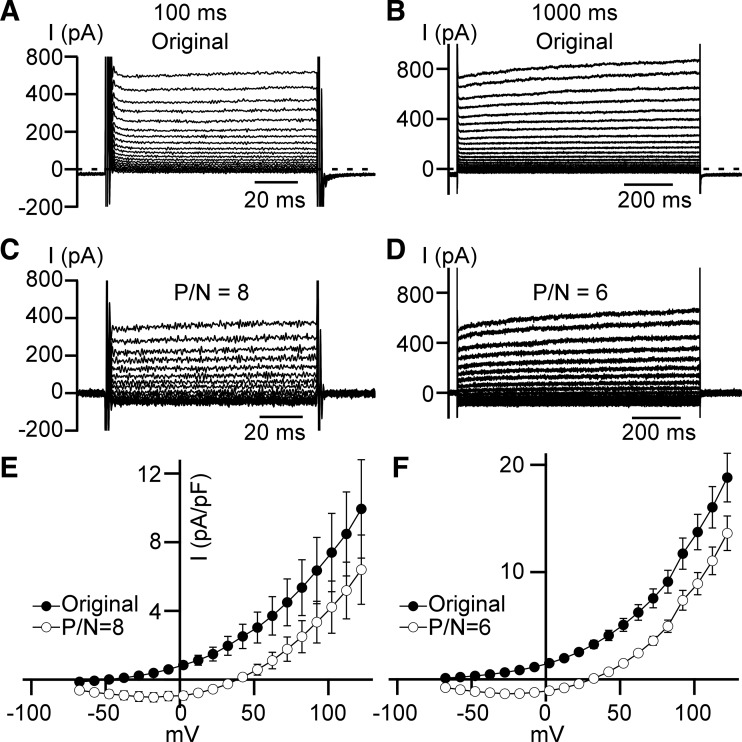
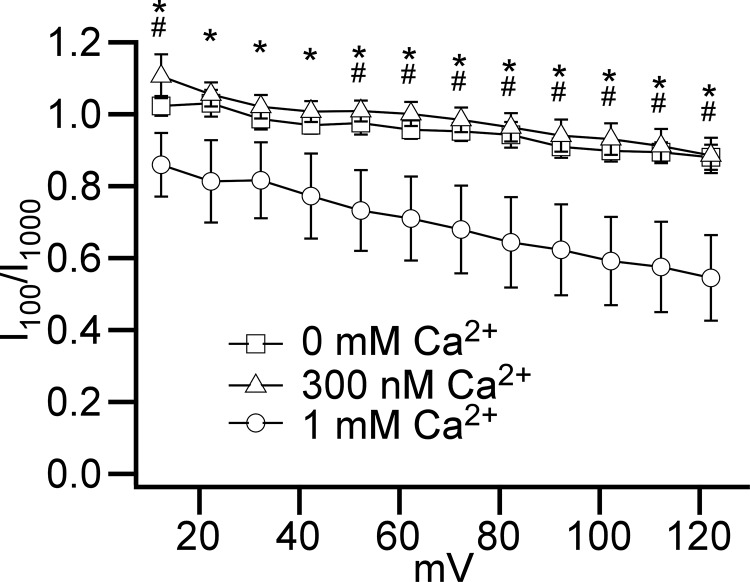
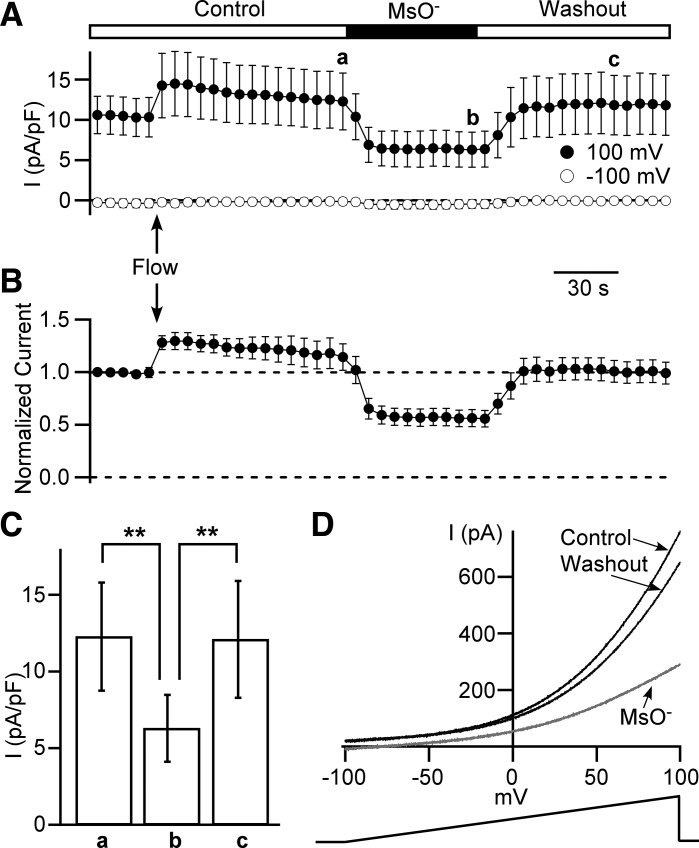
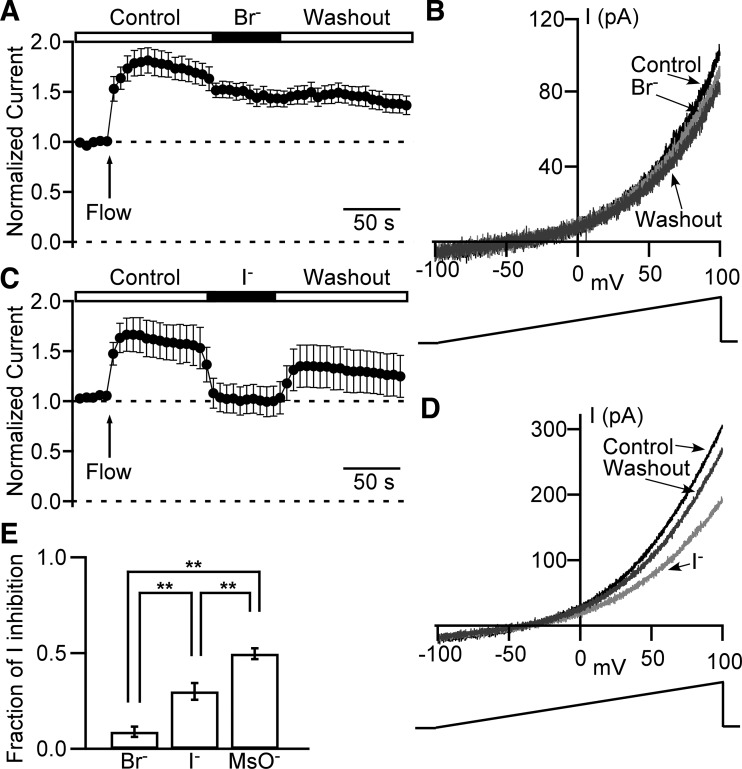
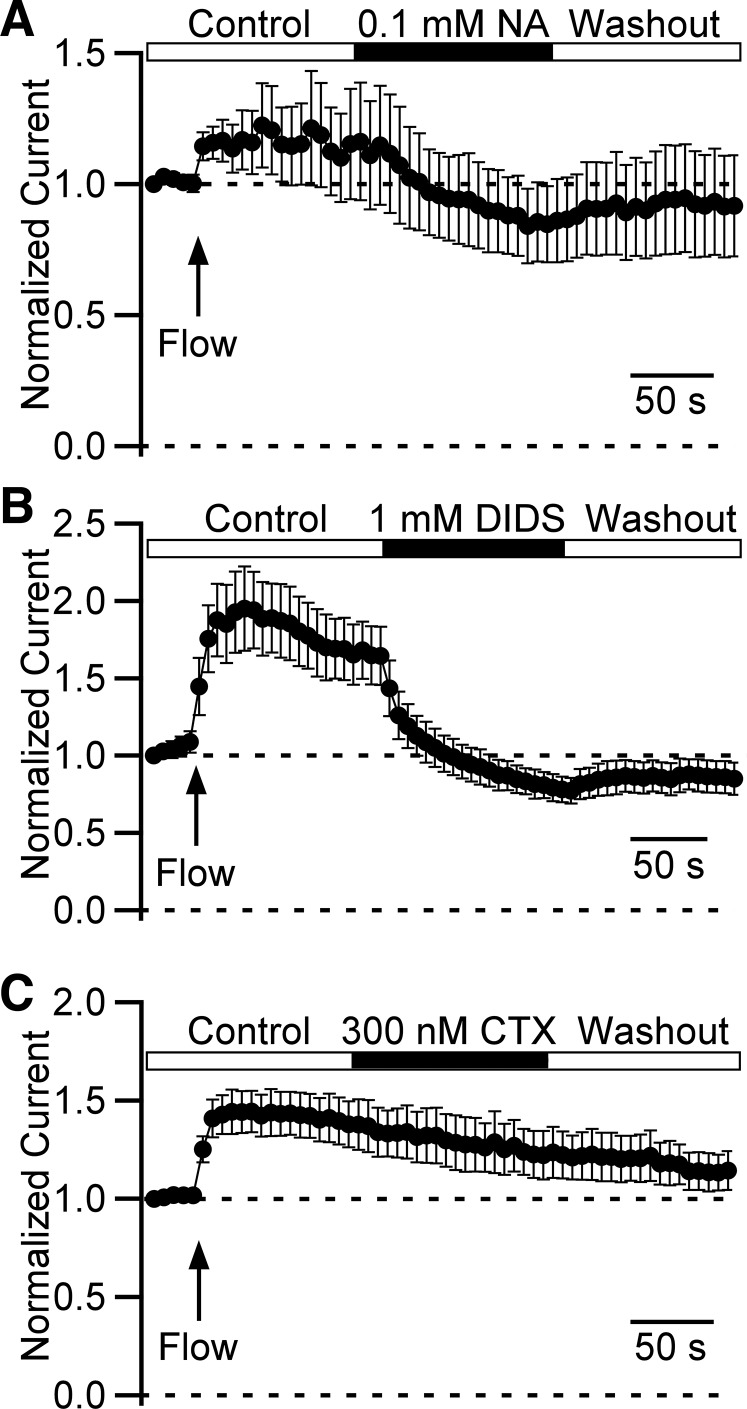
Multiple types of Cl- channels regulate smooth muscle excitability and contractility in vascular, gastrointestinal, and airway smooth muscle cells. However, little is known about Cl- channels in detrusor smooth muscle (DSM) cells. Here, we used inside-out single channel and whole cell patch-clamp recordings for detailed biophysical and pharmacological characterizations of Cl- channels in freshly isolated guinea pig DSM cells. The recorded single Cl- channels displayed unique gating with multiple subconductive states, a fully opened single-channel conductance of 164 pS, and a reversal potential of -41.5 mV, which is close to the ECl of -65 mV, confirming preferential permeability to Cl-. The Cl- channel demonstrated strong voltage dependence of activation (half-maximum of mean open probability, V0.5, ~-20 mV) and robust prolonged openings at depolarizing voltages. The channel displayed similar gating when exposed intracellularly to solutions containing Ca2+-free or 1 mM Ca2+. In whole cell patch-clamp recordings, macroscopic current demonstrated outward rectification, inhibitions by 4,4'-diisothiocyano-2,2'-stilbenedisulfonic acid (DIDS) and niflumic acid, and insensitivity to chlorotoxin. The outward current was reversibly reduced by 94% replacement of extracellular Cl- with I-, Br-, or methanesulfonate (MsO-), resulting in anionic permeability sequence: Cl->Br->I->MsO-. While intracellular Ca2+ levels (0, 300 nM, and 1 mM) did not affect the amplitude of Cl- current and outward rectification, high Ca2+ slowed voltage-step current activation at depolarizing voltages. In conclusion, our data reveal for the first time the presence of a Ca2+-independent DIDS and niflumic acid-sensitive, voltage-dependent Cl- channel in the plasma membrane of DSM cells. This channel may be a key regulator of DSM excitability.

Keywords: chloride; detrusor; ion channel; smooth muscle cell; urinary bladder.


Conflict of interest statement

No conflicts of interest, financial or otherwise, are declared by the authors.

Figures

Fig. 1.
Fig. 1.
Detrusor smooth muscle (DSM)-excised membrane patches display a high-conductance and voltage-dependent Cl single-channel activity. A: representative traces of single-channel activity recorded at different voltages in the same inside-out patch. Closed (c) and opened (o) states are shown as dotted lines. Holding potential for each trace is shown in the top right corner. The scale bars for current and time apply to all traces shown. B: shown is the linear function fitting of the single-channel amplitude (I)–membrane potential (Vm) relationship yielding single-channel conductance = 161 pS and reversal potential = −44.2 mV that is close to Cl equilibrium potential (ECl) = −65 mV; n = 3–14. C: mean open probability (NPo)–membrane potential relationship for data fitted with Boltzmann equation yielded: maximum mean open probability = 0.95, half-maximum of mean open probability (V0.5) = −22.3 ± 4.9 mV, and slope k factor 4.2 ± 1.7 mV (n = 9, N = 6).
Fig. 2.
Fig. 2.
Detrusor smooth muscle (DSM) Cl single-channel activity shows subconductive levels at higher depolarizing potentials. A: a representative trace showing two subconductive levels s1 and s2 (intermediate dotted lines) obtained at a holding potential of +26.5 mV. Top and bottom dotted lines represent opened (o) and closed (c) states. B: a typical trace of Cl single-channel activity at +46.5 mV illustrates substantial dwelling of the channel at subconductive levels s1 and s2 at higher depolarizing potentials. Traces in A and B were recorded from the same excised patch.
Fig. 3.
Fig. 3.
Detrusor smooth muscle (DSM) Cl single-channel activity did not change when intracellular Ca2+ concentration was reduced from 1 mM to 0 mM. A: a representative trace showing no effect of 0 mM Ca2+ cytoplasmic (bath) solution application on Cl channel activity. Holding potential = +76.5 mV. B: mean single-channel open probability was not significantly different between control (1 mM Ca2+) and 0 mM Ca2+ groups (P > 0.05, n = 5, N = 4, paired Student’s t-test).
Fig. 4.
Fig. 4.
Outwardly rectifying whole cell current does not depend on Na+ conductance. A and B: representative recordings of leak-unsubtracted (Original) whole cell step currents. NaCl/Na-Glu (A) and TEA-Cl/TEA-methanesulfonate (B) denote bath and pipette solutions used for these experiments (see materials and methods). C and D: examples of leak-subtracted (P/N = 8) traces obtained at NaCl/Na-Glu (C) and TEA-Cl/TEA-methanesulfonate (D) conditions. E: whole cell current density–membrane potential relationships obtained for NaCl/Na-Glu recording conditions (original and leak-subtracted). Currents were generated by depolarizing 100 ms voltage steps with 10 mV increments (n = 6, N = 2). Closed circles refer to leak-unsubtracted (Original) recordings, and open circles refer to leak-subtracted (P/N = 8) recordings. F: whole cell current density–membrane potential relationships obtained at TEA-Cl/TEA-methanesulfonate conditions. Currents were generated by depolarizing 100 ms voltage steps with 10 mV increments (n = 6, N = 2).
Fig. 5.
Fig. 5.
Sensitivity of outwardly rectifying whole cell current to the high cytoplasmic Ca2+ concentration. A and B: typical leak-unsubtracted (Original) currents of 100 ms (A) and 1,000 ms (B) duration recorded at TEA-Cl/TEA-methanesulfonate-high-Ca2+ conditions (see materials and methods). C and D: representative leak-subtracted [P/N = 8 (C) and P/N = 6 (D)] currents of 100 ms (C) and 1,000 ms (D) intervals. E and F: whole cell current density–membrane potential relationships obtained during 100 ms (E) and 1,000 ms (F) depolarizing steps from −100 mV (n = 7, N = 2). Closed and opened circles are leak-unsubtracted (Original) and leak-subtracted (P/N = 8 and P/N = 6), respectively. *Significant difference (P < 0.05, n = 7, N = 2, unpaired Student’s t-test) between leak-unsubtracted 100 ms (E, closed circles) and 1,000 ms (F, closed circles) long step currents for each voltage indicated. #Significant difference (P < 0.05, n = 7, N = 2, unpaired Student’s t-test) between leak-subtracted 100 ms (E, open circles) and 1,000 ms (F, open circles) long step currents for indicated voltages.
Fig. 6.
Fig. 6.
The 0 mM cytosolic Ca2+ concentration does not affect outward rectification of whole cell current. A and B: typical leak-unsubtracted (Original) currents of 100 ms (A) and 1,000 ms (B) duration at TEA-Cl/TEA-methanesulfonate-zero Ca2+ conditions (see materials and methods). C and D: representative leak-subtracted [P/N = 8 (C) and P/N = 6 (D)] currents of 100 ms (C) and 1,000 ms (D) duration obtained at TEA-Cl/TEA-methanesulfonate-zero Ca2+ conditions. E and F: whole cell current density–membrane potential relationships obtained during 100 ms (E) and 1,000 ms (F) depolarizing steps at TEA-Cl/TEA-methanesulfonate-zero Ca2+ conditions; n = 13, N = 3 in E and n = 10, N = 3 in F. Closed and opened circles represent leak-unsubtracted (Original) and leak-subtracted responses (P/N = 8 and P/N = 6), respectively.
Fig. 7.
Fig. 7.
The presence of a cytoplasmic Ca2+ concentration at the physiological level of 300 nM does not alter outwardly rectifying whole cell current. A and B: typical leak-unsubtracted (Original) currents of 100 ms (A) and 1,000 ms (B) duration recorded at TEA-Cl/TEA-methanesulfonate-physiological-Ca2+conditions (see materials and methods). C and D: representative leak-subtracted [P/N = 8 (C) and P/N = 6 (D)] currents of 100 ms (C) and 1,000 ms (D) intervals. E and F: whole cell current density–membrane potential relationships obtained during 100 ms (E) (n = 7, N = 2) and 1,000 ms (F) (n = 8, N = 2) depolarizing steps from −100 mV. Closed and opened circles are leak-unsubtracted (Original) and leak-subtracted (P/N = 8 and P/N = 6), respectively.
Fig. 8.
Fig. 8.
The high nonphysiological cytosolic 1 mM Ca2+ concentration slows the activation kinetics of the outwardly rectifying current. Shown are the relationships between I100/I1,000 versus membrane potential in the absence (open squares; n = 10, N = 3, TEA-Cl/TEA-methanesulfonate-zero Ca2+ conditions) or the presence of 1 mM (open circles, n = 7, N = 2, TEA-Cl/TEA-methanesulfonate-high-Ca2+ conditions) or 300 nM (open triangles, n = 8, N = 2, TEA-Cl/TEA-methanesulfonate-physiological-Ca2+ conditions) cytoplasmic Ca2+ concentration in the pipette solution. *Membrane potentials at which ratio values for 1 mM were lower than for physiological 300 nM Ca2+ groups (P < 0.05, one-way ANOVA analysis with Tukey’s HSD post hoc test). #Membrane potentials at which ratio values for 1 mM were lower than for 0 mM Ca2+ groups (P < 0.05, one-way ANOVA analysis with Tukey’s HSD post hoc test).
Fig. 9.
Fig. 9.
Effect of low extracellular Cl concentrations on the outwardly rectifying whole cell current density. A and B: time courses of outward current obtained from 1 s long ramps from −100 mV to +100 mV. A: leak-unsubtracted current was measured at +100 mV (closed circles) and −100 mV (opened circles). The time course recording starts in a control (Control) extracellular solution. After the fifth ramp, local perfusion is switched on (marked as “Flow” and arrow) and remains to the end of the recording. After 20th ramp, cells are perfused with a low Cl concentration solution containing 150 mM methanesulfonate anions (MsO) and 10 mM Cl for the next 10 ramps followed by a washout with Control bath solution (see materials and methods). Data points for +100 mV group marked as a, b, and c are used for statistical analysis (see C) (n = 11, N = 3). B: time course of outward current at +100 mV normalized to the first ramp value. C: data group for 10 mM Cl (time point b in A) is significantly lower (**P < 0.01, two-way ANOVA with a Bonferroni posttest correction) from both the control (time point a in A) and washout (time point c in A). D: examples of currents evoked by ramps at time points a (Control, black line), b (methanesulfonate - MsO light gray line), and c (Washout, dark gray line). The duration of the ramp is 1 s, and the rate of membrane potential increase is 0.2 mV/ms.
Fig. 10.
Fig. 10.
Cl channels in DSM cells have permeability preference sequence: Cl>Br>I>MsO. A and C: normalized leak-unsubtracted time courses of the outward current obtained from 1 s long ramps from −100 mV to + 100 mV and measured at +100 mV. Arrows indicate time points of local perfusion starts (also marked as “Flow”). The recording starts in control extracellular solution followed by the isochronic application of Br (n = 12, N = 3) (A) or I (n = 8, N = 3) (C) extracellular solutions and washout. B and D: examples of currents evoked by ramps at time points of control (Control, black) right before switching to Br (B) or I (D), at the end of Br (B) or I (D) application (light gray), and same as Br (B) or I (D) application long duration washout (dark gray). The duration of the ramp is 1 s, and the rate of membrane potential increase is 1 mV/10 ms. E: fractional reduction of whole cell current caused by a replacement of 150 mM Cl with 150 mM Br (n = 12, N = 3), I (n = 8, N = 3), or MsO (n = 11, N = 3). **Significant difference between data groups with P < 0.01 (one-way ANOVA analysis with Tukey’s HSD post hoc test).
Fig. 11.
Fig. 11.
Niflumic acid and DIDS inhibit outwardly rectifying Cl current in detrusor smooth muscle (DSM) cells while chlorotoxin does not. AC: normalized leak-unsubtracted time courses of Cl currents measured at +100 mV caused by repetitive 1 s voltage ramps from −100 mM to +100 mV. Data were normalized to the first data point value. Arrow indicates the beginning of local perfusion (also marked as “Flow”). Isochronic drug applications show inhibitory effects of niflumic acid (NA, n = 5, N = 3) (A) and DIDS (n = 4, N = 3) (B), and no effect of chlorotoxin (CTX, n = 5, N = 3) (C) on Cl current.

Similar articles

Cited by

References

    1. Accardi A, Pusch M. Fast and slow gating relaxations in the muscle chloride channel CLC-1. J Gen Physiol 116: 433–444, 2000. doi:10.1085/jgp.116.3.433. - DOI - PMC - PubMed
    1. Afeli SA, Hristov KL, Petkov GV. Do β3-adrenergic receptors play a role in guinea pig detrusor smooth muscle excitability and contractility? Am J Physiol Renal Physiol 302: F251–F263, 2012. doi:10.1152/ajprenal.00378.2011. - DOI - PMC - PubMed
    1. Alton EW, Manning SD, Schlatter PJ, Geddes DM, Williams AJ. Characterization of a Ca(2+)-dependent anion channel from sheep tracheal epithelium incorporated into planar bilayers. J Physiol 443: 137–159, 1991. doi:10.1113/jphysiol.1991.sp018827. - DOI - PMC - PubMed
    1. Bezanilla F, Armstrong CM. Inactivation of the sodium channel. I. Sodium current experiments. J Gen Physiol 70: 549–566, 1977. doi:10.1085/jgp.70.5.549. - DOI - PMC - PubMed
    1. Boland LM, Brown TA, Dingledine R. Gadolinium block of calcium channels: influence of bicarbonate. Brain Res 563: 142–150, 1991. doi:10.1016/0006-8993(91)91527-8. - DOI - PubMed

Publication types

MeSH terms

Substances

LinkOut - more resources