. 2019 Mar;23(3):1813-1826.
doi: 10.1111/jcmm.14080. Epub 2018 Dec 18.

Organotypic slice culture based on in ovo electroporation for chicken embryonic central nervous system

Affiliations

Organotypic slice culture based on in ovo electroporation for chicken embryonic central nervous system

Ciqing Yang et al. J Cell Mol Med. 2019 Mar.

Abstract

Organotypic slice culture is a living cell research technique which blends features of both in vivo and in vitro techniques. While organotypic brain slice culture techniques have been well established in rodents, there are few reports on the study of organotypic slice culture, especially of the central nervous system (CNS), in chicken embryos. We established a combined in ovo electroporation and organotypic slice culture method to study exogenous genes functions in the CNS during chicken embryo development. We performed in ovo electroporation in the spinal cord or optic tectum prior to slice culture. When embryonic development reached a specific stage, green fluorescent protein (GFP)-positive embryos were selected and fluorescent expression sites were cut under stereo fluorescence microscopy. Selected tissues were embedded in 4% agar. Tissues were sectioned on a vibratory microtome and 300 μm thick sections were mounted on a membrane of millicell cell culture insert. The insert was placed in a 30-mm culture dish and 1 ml of slice culture media was added. We show that during serum-free medium culture, the slice loses its original structure and propensity to be strictly regulated, which are the characteristics of the CNS. However, after adding serum, the histological structure of cultured-tissue slices was able to be well maintained and neuronal axons were significantly longer than that those of serum-free medium cultured-tissue slices. As the structure of a complete single neuron can be observed from a slice culture, this is a suitable way of studying single neuronal dynamics. As such, we present an effective method to study axon formation and migration of single neurons in vitro.

Keywords: central nervous system; chicken embryo; in ovo electroporation; optic tectum; organotypic slice culture; spinal cord.


Figures

Figure 1
Figure 1
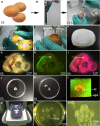
Spinal cord in ovo electroporation and tissue section. (A‐F,J‐M) were imaged using a canon camera; (G‐I,N‐O) were imaged using a stereo fluorescence microscope; (A,B) Incubation of fertilized eggs; (C) Removal of approximately 3‐4 mL of albumin; (D) Injection of plasmid into spinal cord; E: In ovo electroporation; (F) Incubation of the eggs; (G‐I) Material collection; (J‐K) Green fluorescent protein‐positive spinal cord collection; (L) Samples embedded in 4% agar; (M) Tissues sectioned; (N‐O) Sections mounted on the membrane of millicell cell culture insert; sp: spinal cord; Scale bar = 5 mm in (G‐I) and (N‐O)
Figure 2
Figure 2
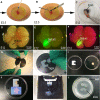
Optic tectum in ovo electroporation and tissue section. (A‐C,G‐L) were imaged using a canon camera; (D‐F) were imaged using a stereo fluorescence microscope; (A) Injection of plasmid into optic tectum; (B) In ovo electroporation; (C) Incubation of the eggs up to stage 38 (E12); (D‐F) Green fluorescent protein‐positive brain collection; (G) 4% agar block; (H‐I) Groove cutting on one side of agar block; (J) Samples embedded in 4% agar; (K) Tissues sectioned; (L) Sections mounted on the membrane of millicell cell culture insert; Scale bar = 5 mm in (D‐F)
Figure 3
Figure 3
Slice culture. (A,G) were imaged using a canon camera; (B‐F,H‐I) were imaged using a stereo fluorescence microscope; (A‐F) Spinal cord slices culturing; (G‐I) Optic tectum slice culturing; (J) Tissue slice culture model. Scale bar = 5 mm in (B‐C,E‐F,H‐I)
Figure 4
Figure 4
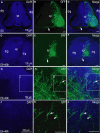
Differences in tissue morphology and neuronal structure between cultured slices and tissue sections in the spinal cord. (A‐P) were imaged using a confocal microscope. (A‐C) Control group pCAGGS‐green fluorescent protein (GFP)‐positive section at stage 26 (E6). (A) 4ʹ,6‐diamidino‐2‐phenylindole (DAPI) nuclear staining, (B,C) GFP expression and merged images. (D‐F) pCAGGS‐GFP‐positive slices at stage 26 (E6) cultured for 48 h; (D) DAPI nuclear stain; (E,F) GFP expression and merged images; (G‐L) Single neuron in culture slices of spinal cord, DAPI nuclear stain (G, higher magnification in J), GFP expression (H, higher magnification in K), and merged image (I, higher magnification in L). sp, spinal cord; drg, dorsal root ganglion. Arrows (→) in (B‐C,E‐F) denote commissural axons. Scale bars, 100 µm in (A,D,G,J) for (A‐L) respectively
Figure 5
Figure 5
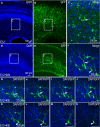
Differences in tissue morphology and neuronal structure between slice cultures and tissue sections in the optic tectum. (A‐N) were imaged using a confocal microscope. (A‐C) Control group, pCAGGS‐GFP‐positive section at stage 38 (E12). (A) 4ʹ,6‐diamidino‐2‐phenylindole (DAPI) nuclear staining; (B) GFP expression. Higher magnification merged images of (A) and (B) are shown in (C). (D‐F) pCAGGS‐green fluorescent protein (GFP)‐positive slices at stage 38 (E12) culture to 48 h; (D) DAPI nuclear staining; (E) GFP expression; Higher magnification merged images of (D) and (E) are shown in (F). (G‐N) A series image of (F) scanning different layers in culture slices of optic tectum. Arrows (→) in (C) denote single neuron in section, Arrows (→) in (F‐N) denotes single neuron of different layers in culture slices. Scale bars, 100 µm in (A,C,D,F,G,K) for (A‐N) respectively
Figure 6
Figure 6
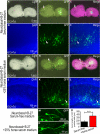
Comparison of tissue morphology and neuronal structure between serum‐free medium and 25% horse serum‐medium slice cultures. (A‐C) and (G‐I) were imaged using a stereo fluorescence microscope; (D‐F) and (J‐L) were imaged using a confocal microscope. (A‐F) used serum‐free medium (Neurobasal added B‐27 as the medium), (A‐C) cultured for 7 d, (D) 4ʹ,6‐diamidino‐2‐phenylindole (DAPI) nuclear staining; (E) Green fluorescent protein (GFP) expression, (D) and (E) merged images are shown (F). (G‐L) used 25% horse serum medium (Neurobasal added B‐27% and 25% horse serum as the medium), (G‐I) cultured for 7 d, (J) DAPI nuclear staining; (K) GFP expression, (J) and (K) merged images are shown in (L). Arrows (→) in (B‐C) and (H‐I) denote GFP‐positive areas in the tectum, Arrows (→) in (E‐F) and (K‐L) denote single neurons from GFP‐positive in culture slices from higher magnification images are show (M) and (N) respectively. (O) Axon lengths of GFP‐positive neurons were compared and the data presented as the mean ± SD. ***P < 0.001. Scale bars, 5 mm in (A,G) for (A‐C) and (G‐I), 100 µm in (D,J) for (D‐F) and (J‐L) respectively.
Figure 7
Figure 7
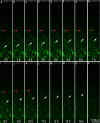
Time‐lapse showing the dynamic migration of neurons. (A‐P) were imaged using a confocal microscope. (A‐P) the time‐lapse result shows the process of dynamic migration of green fluorescent protein‐positive neurons within 0‐16 h. Red arrow (→) in (A‐K) denotes a same single neuron in section at different times as a control. White arrow (→) in (A‐O) denotes the dynamic change of a same single neuron in section at different times. Scale bars, 37.0 µm in (P) for (A‐P) (see Video S1)
Figure 8
Figure 8
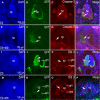
Effects of in ovo electroporation on cell apoptosis and proliferation in slice culture process. (A‐P) were imaged using a confocal microscope. (A‐C) Control group pCAGGS‐green fluorescent protein (GFP)‐positive section at stage 26 (E6), (A) 4ʹ,6‐diamidino‐2‐phenylindole (DAPI) nuclear staining (Blue); (B) GFP expression (green); (C) caspase‐3 expression (red); (D) merged images; (E‐H) pCAGGS‐GFP positive slice at stage 26 (E6) culture to 48 h; (E) DAPI nuclear stain (Blue); (F) GFP expression (green); G: caspase‐3 expression (red); (H) merged images. (I‐L) Control group pCAGGS‐GFP positive section at stage 26 (E6); (I) DAPI nuclear staining (Blue), (J) GFP expression (green), (K) Brd U expression (red), (L) merged images. (M‐P) pCAGGS‐GFP positive slice at stage 26 (E6) culture to 48 h; (M) DAPI nuclear stain (Blue); (N) GFP expression (green); (O) Brd U expression (red). Sp, spinal cord; gm, grey matter; wm, white matter. Arrows (→) in (B,F,G,N) denotes GFP‐positive area, in (C,G) denote caspase‐3 expression in GFP positive area, and in (K,O) denote Brd U expression in GFP positive area. Scale bars, 100 µm in (A,E,I,M) for (A‐P) respectively
Figure 9
Figure 9
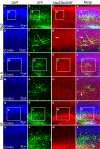
The expression of Map2, NeuN and neurofilament (NF) in cultured chicken optic tectum slice. (A‐X) were imaged using a confocal microscope. (A‐H) the expression of Map2 in pCAGGS‐green fluorescent protein (GFP) positive slices at stage 38 (E12) culture to 48 h; 4ʹ,6‐diamidino‐2‐phenylindole (DAPI) nuclear staining (A, higher magnification areas in E, blue), GFP expression (B, higher magnification areas in F, green), Map2 expression (C, higher magnification areas in G, red), and the merged image (D, higher magnification areas in H) are shown. (I‐P) the expression of NeuN in pCAGGS‐GFP positive slices at stage 38 (E12) cultured for 48 h; DAPI nuclear staining (I, higher magnification areas in M, blue), GFP expression (J, higher magnification areas in N, green), NeuN expression (K, higher magnification areas in O, red), and the merged image (L, higher magnification areas in P) are shown. (Q‐X) the expression of NF in pCAGGS‐GFP positive slices at stage 38 (E12) culture to 48 h; DAPI nuclear staining (Q, higher magnification areas in U, blue), GFP expression (R, higher magnification areas in V, green), NF expression (S, higher magnification areas in W, red) and the merged image (T, higher magnification areas in X) are shown. Scale bars, 100 µm in (A,E,I,M,Q,U) for (A‐X) respectively
Figure 10
Figure 10
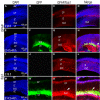
Comparison of GFAP and Iba1 expression in vivo and in culture slices of mouse cerebral cortex. (A‐P) were imaged using a confocal microscope. (A‐D) GFAP expression result in an in vivo slice of mouse cerebral cortex. (A) 4ʹ,6‐diamidino‐2‐phenylindole (DAPI) nuclear staining; (B) green fluorescent protein (GFP) expression, (C) GFAP expression; (A), (B) and (C) merged images are shown (D). (E‐H) culture slice of mouse cerebral cortex GFAP expression result. (E) DAPI nuclear staining; (F) GFP expression, (G) GFAP expression; (E), (F) and (G) merged images are shown (H). Arrow in (H) show GFP and GFAP double‐positive cells. (I‐L) in vivo slice of mouse cerebral cortex Iba1 expression result. (I) DAPI nuclear staining; (J) GFP expression, (K) GFAP expression; (I), (J) and (K) merged images are shown (L). (M‐P) results of Iba1 expression in culture slices of mouse cerebral cortex. (M) DAPI nuclear staining; (N) GFP expression, (O) Iba1 expression; (M), (N) and (O) merged images are shown (P). Arrow in (P) show GFP and Iba1 double‐positive cells. Abbreviations: MZ, Marginal zone; CP, Cortical plate; IZ, Intermediate zone; SVZ, subventricular zone; VZ, ventricular zone. Scale bars, 100 µm in (A,E,I,M) for (A‐P) respectively

Similar articles

References

    1. Gähwiler BH. Organotypic monolayer cultures of nervous tissue. J Neurosci Methods. 1981;4:329‐342. - PubMed
    1. Gähwiler BH. Morphological differentiation of nerve cells in thin organotypic cultures derived from rat hippocampus and cerebellum. Proc R Soc Lond B Biol Sci. 1981b;211:287‐290. - PubMed
    1. Gähwiler BH. Organotypic cultures of neural tissue. Trends Neurosci. 1988;11:484‐489. - PubMed
    1. Stoppini L, Buchs PA, Muller D. A simple method for organotypic cultures of nervous tissue. J Neurosci Methods. 1991;37:173‐182. - PubMed
    1. Radic T, Jungenitz T, Singer M, et al. Time‐lapse imaging reveals highly dynamic structural maturation of postnatally born dentate granule cells in organotypic entorhino‐hippocampal slice cultures. Sci Rep. 2017;7:43724. - PMC - PubMed

Publication types

Substances