. 2018 Dec 18;9(1):5366.
doi: 10.1038/s41467-018-07780-z.

HDX-MS reveals dysregulated checkpoints that compromise discrimination against self RNA during RIG-I mediated autoimmunity

Affiliations

HDX-MS reveals dysregulated checkpoints that compromise discrimination against self RNA during RIG-I mediated autoimmunity

Jie Zheng et al. Nat Commun. .

Abstract

Retinoic acid inducible gene-I (RIG-I) ensures immune surveillance of viral RNAs bearing a 5'-triphosphate (5'ppp) moiety. Mutations in RIG-I (C268F and E373A) lead to impaired ATPase activity, thereby driving hyperactive signaling associated with autoimmune diseases. Here we report, using hydrogen/deuterium exchange, mechanistic models for dysregulated RIG-I proofreading that ultimately result in the improper recognition of cellular RNAs bearing 7-methylguanosine and N1-2'-O-methylation (Cap1) on the 5' end. Cap1-RNA compromises its ability to stabilize RIG-I helicase and blunts caspase activation and recruitment domains (CARD) partial opening by threefold. RIG-I H830A mutation restores Cap1-helicase engagement as well as CARDs partial opening event to a level comparable to that of 5'ppp. However, E373A RIG-I locks the receptor in an ATP-bound state, resulting in enhanced Cap1-helicase engagement and a sequential CARDs stimulation. C268F mutation renders a more tethered ring architecture and results in constitutive CARDs signaling in an ATP-independent manner.


Conflict of interest statement

The authors declare no competing interests.

Figures

Fig. 1
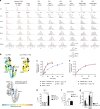
Fig. 1
RNA chemical structures and IFN-β activity. a Domain arrangement of RIG-I (1–925). Autoinhibition is shown between CARD2 latch region and HEL2i gate motif. b The chemical structures of an m7G cap and 2′-O-methylation modification at N1 or N2 position are presented. Important features for Cap0, Cap1, Cap0mA, and Cap2 are highlighted. c Schematic representations of studied 8- and 10-mer hairpin RNAs that bear different modifications at the 5′RNA terminus. 3p10l and Cap1-10l represent the molecular signature of viral and self-RNA, respectively. d The IFN-β luciferase signal is plotted as recorded in WT/SMS RIG-I dual reporter assays stimulated with indicated RNAs. Basal IFN-β activity of WT RIG-I in the absence of RNA transfection was subtracted. The significance of differences between groups was evaluated by unpaired Student’s t test (*p < 0.05; **p < 0.01). e ATPase activities of Cap1-10l- and 3p10l-bound WT/SMS RIG-I. The significance of differences between groups was evaluated by unpaired Student’s t test (*p < 0.05)
Fig. 2
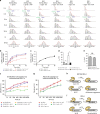
Fig. 2
Partial opening of CARDs upon RNA surveillance by WT and H830A RIG-I. a MS spectra of RIG-I CARD2 latch peptide Y103–114 derived from various complexes at the indicated on-exchange time points. b HDX single amino acid consolidation view of apo RIG-I (Supplementary Fig. 1a, b and c, column (i) and (ii)) are, respectively, mapped to the CARDs-HEL2i structure model (upper left panel) and single CARDs structure (upper right panel), representing auto-repressed and solvent-exposed CARDs conformational dynamics. The location of CARD2 latch peptide is highlighted in the structure model (below). Percentages of deuterium uptake are color coded according to HDX dynamics key. Black, regions that have no sequence coverage and include proline residue that has no amide hydrogen exchange activity. c and e The fraction of WT or H830A RIG-I CARDs molecules in the higher MS population (open conformation) to the total population is plotted against the on-exchange time points. d, f Half-life (t1/2) of respective partial opening event is determined by fitting an exponential 3P with the prediction model: a + b × exp(c.time(min)), where a is the asymptote, b is the scale, and c is the growth rate, is used to fit a curve to %D (response) and time (regressor). Inverse prediction is used to solve for the half-life (t1/2) for each conformational state. (*Means that Cap1-10l-treated group predicted t1/2 (42.53 min) was higher than the upper limit (24.67, α = 0.05), whereas 3p10l ATP, Cap0-10l, and Cap0mA-10l-treated groups did not exceed the lower or upper limits in this comparison; NS means statistically nonsignificant between compared group. t1/2 calculated for 3p10l-bound H830A RIG-I and Cap1-10l-bound H830A RIG-I did not exceed the lower or upper limits (α = 0.05) in this comparison.) g The IFN-β luciferase signal is plotted as recorded in WT/H830A RIG-I dual reporter assays stimulated with indicated RNAs. The significance of differences between groups was evaluated by Student’s t test (*p < 0.05; **p < 0.01)
Fig. 3
Fig. 3
E373A affects RIG-I proofreading in an ATP-dependent manner. a MS spectra of WT and E373A RIG-I CARD2 latch peptide Y103–114 derived from indicated complexes in indicated on-exchange time points. The abundance of each mass population (high and low) is determined as Fig. 2a. b, c In each indicated state, the fraction of E373A (b) or WT (c) RIG-I CARDs molecules in the higher MS population (open conformation) to the total population is plotted against the on-exchange time points as Fig. 2c. d, e Half-life (t1/2) of respective partial opening event is determined by fitting an exponential curve as Fig. 2d. (*Means that Cap1-10l-treated E373A RIG-I (20.51 min) and 3p10l-treated E373A RIG-I predicted t1/2 (72.7 min) was higher than the upper limit (58.44 and 16.95, respectively, α = 0.05), whereas t1/2 calculated 3p10l- and ATP-treated E373A RIG-I (12.11 min) exceeded lower limit (13.33, α = 0.05). Cap1-10l- and ATP-treated E373A did not exceed the lower or upper limits in this comparison. NS means statistically nonsignificant between compared groups. t1/2 calculated for Cap1-10l-bound WT RIG-I and Cap1-10l- and ATP-treated WT RIG-I did not exceed the lower or upper limits (α = 0.05) in this comparison.) f, g Differential deuterium uptake plots of CTD capping loop peptide region (VSRPHPKPKQFSSF, +3) of E373A (f) or WT RIG-I (g) upon receptor perturbed by 3p10l or Cap1-10l RNA in the presence or absence of ATP. The data are plotted as percent deuterium uptake vs. time on a logarithmic scale. The HDX plots of this CTD capping loop peptide between indicated groups were statistically analyzed by HDX Workbench (Supplementary Fig. 1c). h, i Schematic representations of CTD capping loop conformation associated with E373A (h) and WT RIG-I (i) upon the receptor interaction with ATP in the presence of Cap1-10l and 3p10l RNAs
Fig. 4
Fig. 4
C268F RIG-I becomes constitutive signaling upon 5′ppp and Cap1 RNA binding. Schematic representations illustrate differential experiments of apo C268F RIG-I vs. C268F RIG-I associated with indicated RNA (on the left). Differential single amino acid consolidation HDX data are mapped onto the full-length RNA-bound RIG-I structure model in ribbon (on the right), as shown by representation of altered conformational dynamics of receptor upon binding to a 3p10l (Supplementary Fig. 1a, b and c, column (xxiv)), b Cap1-10l (Supplementary Fig. 1a, b and c, column (xxv)), and c 3p8l (Supplementary Fig. 1a, b and c, column (xxiv)). Percentages of deuterium differences are color coded according to the key (below). Black, regions that have no sequence coverage and include proline residue that has no amide hydrogen exchange activity; gray, no statistically significant changes between compared states; purple, duplex RNA ligand. d The fraction of C268F RIG-I CARDs molecules in the higher MS population (open conformation) to the total population is plotted against the incubation HDX time points as Fig. 2c. e Half-life (t1/2) of the respective partial opening event is determined by fitting an exponential 3P with the prediction model as Fig. 2d. (* Means that t1/2 calculated 3p8l-bound C268F RIG-I (16.85 min) exceeded the lower limit (13.80, α = 0.05) in the indicated compassion, whereas both 3p10l- and Cap1-10l-bound C268F RIG-I did not exceed the lower or upper limits in this comparison
Fig. 5
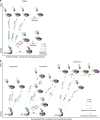
Fig. 5
Functional and dysregulated checkpoints of RIG-I proofreading. a Schematic representations of functional RIG-I checkpoints governing RIG-I CARDs conformational transition. b Schematic representations of aberrant CARDs conformational transition of RIG-I gain-of-function mutants revealed by comprehensive differential HDX analysis with quantitative analysis of CARDs EX1 exchange kinetics

Similar articles

Cited by

References

    1. Devarkar SC, et al. Structural basis for m7G recognition and 2′-O-methyl discrimination in capped RNAs by the innate immune receptor RIG-I. Proc. Natl. Acad. Sci. USA. 2016;113:596–601. doi: 10.1073/pnas.1515152113. - DOI - PMC - PubMed
    1. Goubau D, et al. Antiviral immunity via RIG-I-mediated recognition of RNA bearing 5′-diphosphates. Nature. 2014;514:372. doi: 10.1038/nature13590. - DOI - PMC - PubMed
    1. Kato H, Takahasi K, Fujita T. RIG-I-like receptors: cytoplasmic sensors for non-self RNA. Immunol. Rev. 2011;243:91–98. doi: 10.1111/j.1600-065X.2011.01052.x. - DOI - PubMed
    1. Zheng J, et al. High-resolution HDX-MS reveals distinct mechanisms of RNA recognition and activation by RIG-I and MDA5. Nucleic Acids Res. 2015;43:1216–1230. doi: 10.1093/nar/gku1329. - DOI - PMC - PubMed
    1. Loo YM, Gale M., Jr. Immune signaling by RIG-I-like receptors. Immunity. 2011;34:680–692. doi: 10.1016/j.immuni.2011.05.003. - DOI - PMC - PubMed

Publication types

MeSH terms