. 2018 Dec 18;9(1):5358.
doi: 10.1038/s41467-018-07734-5.

The intralumenal fragment pathway mediates ESCRT-independent surface transporter down-regulation

Affiliations

The intralumenal fragment pathway mediates ESCRT-independent surface transporter down-regulation

Erin Kate McNally et al. Nat Commun. .

Abstract

Surface receptor and transporter protein down-regulation is assumed to be exclusively mediated by the canonical multivesicular body (MVB) pathway and ESCRTs (Endosomal Sorting Complexes Required for Transport). However, few surface proteins are known to require ESCRTs for down-regulation, and reports of ESCRT-independent degradation are emerging, suggesting that alternative pathways exist. Here, using Saccharomyces cerevisiae as a model, we show that the hexose transporter Hxt3 does not require ESCRTs for down-regulation conferring resistance to 2-deoxyglucose. This is consistent with GFP-tagged Hxt3 bypassing ESCRT-mediated entry into intralumenal vesicles at endosomes. Instead, Hxt3-GFP accumulates on vacuolar lysosome membranes and is sorted into an area that, upon fusion, is internalized as an intralumenal fragment (ILF) and degraded. Moreover, heat stress or cycloheximide trigger degradation of Hxt3-GFP and other surface transporter proteins (Itr1, Aqr1) by this ESCRT-independent process. How this ILF pathway compares to the MVB pathway and potentially contributes to physiology is discussed.


Conflict of interest statement

The authors declare no competing interests.

Figures
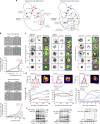
Fig. 1
Fig. 1
Internalized transporter proteins take two routes to the vacuole lumen for degradation. a Cartoon illustrating how surface transporter proteins Can1 or Hxt3 are sorted for degradation by MVB or ILF pathways, respectively. b Micrographs of yeast treated with the toxin 2-deoxyglucose (top) or canavanine (bottom) and stained with methylene blue to detect dead (MB+) cells indicated by white arrowheads. Graphs show relative number of dead cells observed at increasing concentrations of either toxin. Means ± S.E.M. plotted. *P < 0.05, as compared to WT values by t-test. For 2-deoxyglucose treatment, n = 3 experiments, whereby a total of 2355 WT, 2105 hxt3∆, 1,786 vps27∆ and 1413 vps36∆ cells were analyzed. For canavanine treatment, n = 3 experiments whereby 2671 WT, 2033 can1∆, 1647 vps27∆ and 1,538 vps36∆ cells were analyzed. c Micrographs showing route taken by Can1-GFP from the surface to the vacuole lumen in response to 340.6 µM canavanine over 8 h in live wild type cells (right) or Hxt3-GFP in response to 0.2 mM 2-deoxyglucose over 120 min in live wild type (left) or vps36∆ (middle) cells. All cells were treated with FM4–64 to label vacuole membranes. Black arrowheads indicate GFP on the vacuole membrane. d Three-dimensional GFP fluorescence intensity (FI) plots and line plots of Can1-GFP (right), Hxt3-GFP (middle, left) or FM4–64 fluorescence intensity for micrographs with lines shown in c, to indicate vacuole membrane localization. Can1-GFP vacuole distribution is shown at 6 h because intensity was too low at 4 h to generate informative plots. e Using micrographs shown in c, we calculated the proportion of wild type or vps36∆ cells showing Can-GFP (right) or Hxt3-GFP (middle, left) fluorescence on the plasma membrane (PM), intracellular puncta, vacuole membrane (Vac mem) or vacuole lumen over time after treatment with canavanine or 2-deoxyglucose. For Hxt3-GFP at 0, 5, 30, 60, 120 min, n = 195, 198, 200, 207, 214 WT cells, and n = 202, 205, 207, 266, 211 vps36∆ cells analyzed. For Can1-GFP at 0, 2, 4, 6, 8 h, n = 207, 210, 246, 220, 208 WT cells analyzed. f Western blot analysis of whole-cell lysates prepared from wild type (left) or vps36∆ (middle) cells expressing Hxt3-GFP before (0 min) or 5–120 min after treatment with 0.2 mM 2-deoxyglucose or wild-type cells expressing Can1-GFP before or after treatment with 340.6 µM canavanine. Blots were stained for GFP or glucose-6-phosphate dehydrogenase (G6PDH; as load controls). Estimated molecular weights and cleaved GFP band densities relative to 0 min normalized to load controls are shown. Blots shown are representatives of n = 5 experiments. Scale bars, 1 µm
Fig. 2
Fig. 2
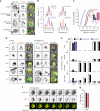
Hxt3-GFP is selectively degraded by the ILF pathway in response to 2-deoxyglucose. a Micrographs of live wild type cells expressing GFP-tagged Hxt3 after treatment with 2-deoyglucose for 30 min, or canavanine for 30 min or 6 h. Vacuole membranes were stained with FM4–64. Arrowhead indicates GFP on the vacuole membrane. b Line plots of GFP or FM4–64 fluorescence intensity for lines shown in a and d, to indicate vacuole membrane localization. GFP values greater than the FM4–64 signal at boundaries (near 2, for two membranes) indicate enrichment. c Using micrographic data presented in a and d, we generated cumulative probability plots of GFP- tagged Hxt3, Fet5, Vph1 or Fth1 fluorescence measured within the boundary membrane of docked vacuoles within live wild-type cells in the absence or presence of 2-deoxyglucose (2DG). Averages ± S.E.M. are shown in insets. *P > 0.05, as compared to Vph1 by t-test. n = 3 experiments whereby 72 Vph1-GFP, 77 Fet5-GFP, 107 Fth1-GFP or 82 Hxt3-GFP + 2DG boundaries within cells were analyzed. d Micrographs of live wild type cells expressing GFP-tagged resident vacuole transporters Fet5, Vph1 or Fth1, or surface transporters Can1 or Itr1, before (control) after treatment with 2-deoxyglucose for 30 min. Vacuole membranes were stained with FM4–64. e Using micrographs shown in a and d, we calculated the proportion of wild type cells showing GFP fluorescence on the plasma membrane (PM), intracellular puncta, vacuole membrane (Vac Mem) or vacuole lumen (Vac Lumen) after treatment with 2-deoxyglucose or canavanine. For control conditions, n = 218 Hxt3-GFP, 187 Fet5-GFP, 265 Vph1-GFP, 267 Fth1-GFP, 233 Can1-GFP, and 189 Itr1-GFP cells. After 2-deoxyglucose treatment, n = 200 Hxt3-GFP, 143 Fet5-GFP, 128 Vph1-GFP, 161 Fth1-GFP, 150 Can1-GFP, and 178 Itr1-GFP cells. For canavanine treatment, n = 171 or 166 Hxt3-GFP cells after 0.5 or 6 h, respectively. f Images from time-lapse video showing a homotypic vacuole fusion event within a live wild-type cell expressing Hxt3-GFP stained with FM4–64 to label vacuole membranes and treated with 2-deoxyglucose. Arrowhead indicates newly formed ILF. See Supplementary Movie 1. g Analysis of micrographic data shown in f showing the proportion of cells that displayed a vacuole fusion event within 5 min in the absence (CTL) or presence of 2-deoxyglucose (2DG). Averages ± S.E.M. are shown. P > 0.05, when 2DG was compared to CTL by t-test. n = 5 experiments whereby a total of 121 (CTL) or 174 (2DG) Hxt3-GFP cells were analyzed. Scale bars, 1 µm
Fig. 3
Fig. 3
Quality control of Hxt3-GFP is mediated by the ILF pathway. a Fluorescence and DIC micrographs of live wild type or vps36∆ cells expressing GFP-tagged Hxt3 before (control) or after heat stress (37 °C for 15 min). Vacuole membranes were stained with FM4–64. Arrowheads indicate GFP on the vacuole membrane. 3-dimensional GFP fluorescence intensity (FI) plots and line plots of Hxt3-GFP or FM4–64 fluorescence intensity for lines shown in a, to indicate vacuole membrane localization after heat stress. b Micrographic data shown in a was used to calculate the proportion of wild type or vps36∆ cells that show Hxt3-GFP fluorescence on the plasma membrane (PM), intracellular puncta, vacuole membrane (Vac Mem) or vacuole lumen (Vac Lumen) before or after treatment with heat stress. Under control (CTL) conditions, n = 218 WT cells or 243 vps36∆ cells under control conditions (CTL); n = 163 WT cells or 196 vps36∆ cells after heat stress. c, d Micrographic data shown in a was used to generate cumulative probability plots of Hxt3-GFP fluorescence measured within the boundary membrane (c) or lumen (d) of vacuoles within live wild type or vps36∆ cells before or after heat stress (HS). GFP-tagged Fet5 (excluded), Vph1 (ubiquitous) and Fth1 (enriched) are shown for reference (see Fig. 2D). Averages ± S.E.M. are shown in insets. *P < 0.05, as compared to Vph1 by t-test. n = 3 experiments whereby a total of 81 WT or 102 vps36∆ cells were analyzed under control conditions, and 75 WT or 88 vps36∆ cells were analyzed after heat stress. e Images from time-lapse videos showing homotypic vacuole fusion events within live wild type or vps36∆ cell expressing Hxt3-GFP treated with heat stress. Vacuole membranes were stained with FM4–64. Arrowheads indicate newly formed ILFs. See Supplementary Movies 2 and 4. Example shown is a representation of n = 4 experiments. f Western blot analysis of whole-cell lysates prepared from wild-type or vps36∆ cells expressing Hxt3-GFP after heat stress (HS) stained with anti-GFP antibody. Estimated molecular weights and cleaved GFP band densities relative to CTL normalized to load controls (G6PDH) are shown. Blots shown are representatives of n = 3 experiments. Scale bars, 1 µm
Fig. 4
Fig. 4
Cycloheximide triggers Hxt3-GFP degradation by the ILF pathway. a Fluorescence and DIC micrographs of live wild-type or vps36∆ cells expressing GFP-tagged Hxt3 before (control) and after treatment with 100 µM cycloheximide for 45 min. Vacuole membranes were stained with FM4–64. Arrowheads indicate GFP on the vacuole membrane. Three-dimensional GFP fluorescence intensity (FI) plots and line plots of Hxt3-GFP or FM4–64 fluorescence intensity for lines shown in a, to indicate vacuole membrane localization after cycloheximide treatment. b Micrographic data shown in a was used to calculate the proportion of wild type (n = 142) or vps36∆ (n = 158) cells that show Hxt3-GFP fluorescence on the plasma membrane (PM), intracellular puncta, vacuole membrane (Vac Mem) or vacuole lumen (Vac Lumen) after treatment with cycloheximide. Values before cycloheximide treatment are shown for reference (see Fig. 3b). c, d Micrographic data shown in a was used to generate cumulative probability plots of Hxt3-GFP fluorescence measured within the boundary membrane (c) or lumen (d) of vacuoles within live wild-type or vps36∆ cells after treatment with cycloheximide (CHX). GFP-tagged Fet5 (excluded), Vph1 (ubiquitous), and Fth1 (enriched; see Fig. 2d) and lumenal values before cycloheximide treatment (see Fig. 3d) are shown for reference. Averages ± S.E.M. are shown in insets. *P < 0.05, as compared to Vph1 by t-test. n = 5 experiments whereby a total of 73 wild type cells or 108 vps36∆ cells after CHX treatment were analyzed. e Images from time-lapse videos showing homotypic vacuole fusion events within live wild type or vps36∆ cell expressing Hxt3-GFP treated with cycloheximide. Vacuole membranes were stained with FM4–64. Arrowheads indicate initial fusion sites leading to ILF formation. See Supplementary Movies 3 and 5. Examples shown are representatives of n = 4 experiments. f Western blot analysis of whole-cell lysates prepared from wild type or vps36∆ cells expressing Hxt3-GFP before (CTL) or after treatment with cycloheximide (CHX) stained with anti-GFP antibody. Estimated molecular weights and cleaved GFP band densities relative to CTL normalized to load controls (G6PDH) are shown. Blots shown are representatives of n = 4 experiments. Scale bars, 1 µm
Fig. 5
Fig. 5
The ILF pathway machinery is responsible for Hxt3-GFP degradation. a Fluorescence and DIC micrographs of live wild-type cells expressing GFP-tagged Hxt3 before (untreated cells) and at stages of the vacuole isolation procedure, including after oxalyticase treatment to form spherophasts, after DEAE-dextran treatment to permeabilize spheroplasts, and isolated vacuoles. Untreated cells in SC medium were also withdrawn from glucose for 5 min. Vacuole membranes were stained with FM4–64. Micrographs shown are examples from n = 3 experiments. b Fluorescence micrographs of vacuoles isolated from wild type (left) or vps36∆ (right) cells after 30 min of fusion in the absence (CTL) or presence of heat stress (HS) or cycloheximide (CHX) with or without fusion inhibitors (4 µM rGdi1 and 3.2 µM rGyp1–46; F.I.). Vacuole membranes were stained with FM4–64 and 3-dimensional fluorescence intensity (FI) plots of Hxt3-GFP are shown. Boundary membranes indicating Hxt3-GFP enrichment (closed arrowheads) and exclusion (open arrowheads) are shown. c, d Micrographic data shown in b was used to generate cumulative probability plots of Hxt3-GFP fluorescence measured within the boundary membrane (c) or lumen (d) of vacuoles isolated from wild-type (top) or vps36∆ (bottom) cells before (CTL) and after treatment with HS or CHX with or without fusion inhibitors (F.I.). Means ± S.E.M. are shown in insets. *P < 0.05, as compared to CTL by t-test. n = 3 experiments whereby a total of 113, 108, 120, 110, 108, 107 WT vacuoles or 133, 110, 128, 112, 116, 109 vps36∆ vacuoles were analyzed under CTL, CTL + FI, HS, HS + F.I., CHX, CHX + F.I. conditions, respectively. e Western blot analysis of Hxt3-GFP degradation before (0 min) or after (120 min) vacuoles isolated from wild type (top) or vps36∆ (bottom) cells underwent fusion in the absence (CTL) or presence of HS (left) or CHX (right) with or without pretreatment with fusion inhibitors (F.I.). Estimated molecular weights and cleaved GFP band densities (Dens.) relative to 0 min normalized to load controls (Pho8) are shown. Representatives of n = 4 experiments are shown. Scale bars, 2 µm
Fig. 6
Fig. 6
Hxt3-GFP is cleared from vacuole membranes during fusion in vitro. a Fluorescence micrographs of vacuoles isolated from wild type cells expressing Hxt3-GFP acquired over the course of the in vitro fusion reaction in the absence (control; left) or presence (right) of heat stress. Vacuole membranes were stained with FM4–64. Scale bar, 2 µm. b, c Using micrographic data shown in a, averages ± S.E.M. of Hxt3-GFP fluorescence intensity were measured within the lumen (b) or outside membrane (c) of vacuoles isolated from wild-type cells over the course of the fusion reaction with or without heat stress. *P < 0.05, as compared to CTL by t-test. n = 5 experiments whereby a total of 89, 88, 118, 100, 85 vacuoles were analyzed under CTL conditions, and 85, 108, 116, 110, 108 vacuoles were analyzed after HS, at 0, 30, 60, 90, 120 min, respectively. d Line plots of Hxt3-GFP and FM4–64 fluorescence, and 3-dimensional GFP fluorescence intensity (FI) plots of from micrographs in a showing vacuoles isolated from wild type cells before (0 min) and after 120 min of fusion after heat stress, to indicate that Hxt3-GFP is completely cleared from vacuole membranes over time in vitro
Fig. 7
Fig. 7
Quality control of surface transporters Itr1 and Aqr1 is mediated by the ILF pathway. a Fluorescence and DIC micrographs of live wild type (top) and vps27∆ (bottom) cells expressing GFP-tagged Hxt3, Itr1, Aqr1, Ste3, or Mup1 before (control) and after heat stress (37 °C for 15 min). Vacuole membranes were stained with FM4–64. Arrowheads indicate GFP on the vacuole membrane. Scale bar, 1 µm. b Three-dimensional GFP fluorescence intensity (FI) plots and line plots (left) of GFP or FM4–64 fluorescence intensity for lines shown in a to indicate boundary membrane localization after heat stress. c, d Using micrographic data shown in a, we measured the proportion of wild type or vps27∆ cells with GFP fluorescence observed on the vacuole membrane (c) or within the lumen (d) before (CTL) or after heat stress. Averages ± S.E.M. are shown. *P < 0.05, as compared to CTL by t-test. n = 4 experiments whereby a total of 238 Hxt3-GFP cells, 180 Itr1-GFP cells, 180 Aqr1-GFP cells were analyzed under CTL conditions, and 222 Hxt3-GFP cells, 161 Itr1-GFP, 167 Aqr1-GFP cells were analyzed after HS. e Western blot analysis of whole-cell lysates prepared from wild type or vps27∆ cells expressing Itr1-GFP or Aqr1-GFP before (CTL) or after heat stress (HS) stained with anti-GFP antibody. Estimated molecular weights and cleaved GFP band densities (Dens.) relative to CTL normalized to load controls (G6PDH) are shown. Blots are representatives of n = 3 experiments

Similar articles

Cited by

References

    1. Babst M. MVB vesicle formation: ESCRT-dependent, ESCRT-independent and everything in between. Curr. Opin. Cell Biol. 2011;23:452–457. doi: 10.1016/j.ceb.2011.04.008. - DOI - PMC - PubMed
    1. Katzmann DJ, Odorizzi G, Emr SD. Receptor downregulation and multivesicular-body sorting. Nat. Rev. Mol. Cell Biol. 2002;3:893–905. doi: 10.1038/nrm973. - DOI - PubMed
    1. Henne WM, Buchkovich NJ, Emr SD. The ESCRT pathway. Dev. Cell. 2011;21:77–91. doi: 10.1016/j.devcel.2011.05.015. - DOI - PubMed
    1. Palacios F, Tushir JS, Fujita Y, D’Souza-Schorey C. Lysosomal targeting of E-cadherin: a unique mechanism for the down-regulation of cell-cell adhesion during epithelial to mesenchymal transitions. Mol. Cell. Biol. 2005;25:389–402. doi: 10.1128/MCB.25.1.389-402.2005. - DOI - PMC - PubMed
    1. Rodahl LM, Stuffers S, Lobert VH, Stenmark H. The role of ESCRT proteins in attenuation of cell signalling. Biochem. Soc. Trans. 2009;37:137–142. doi: 10.1042/BST0370137. - DOI - PubMed

Publication types

MeSH terms

Substances