. 2018 Nov 30:9:2814.
doi: 10.3389/fimmu.2018.02814. eCollection 2018.

CD32 Ligation Promotes the Activation of CD4+ T Cells

Affiliations

CD32 Ligation Promotes the Activation of CD4+ T Cells

María Pía Holgado et al. Front Immunol. .

Abstract

Low affinity receptors for the Fc portion of IgG (FcγRs) represent a critical link between innate and adaptive immunity. Immune complexes (ICs) are the natural ligands for low affinity FcγRs, and high levels of ICs are usually detected in both, chronic viral infections and autoimmune diseases. The expression and function of FcγRs in myeloid cells, NK cells and B cells have been well characterized. By contrast, there are controversial reports about the expression and function of FcγRs in T cells. Here, we demonstrated that ~2% of resting CD4+ T cells express cell surface FcγRII (CD32). Analysis of CD32 expression in permeabilized cells revealed an increased proportion of CD4+CD32+ T cells (~9%), indicating that CD4+ T cells store a CD32 cytoplasmic pool. Activation of CD4+ T cells markedly increased the expression of CD32 either at the cell surface or intracellularly. Analysis of CD32 mRNA transcripts in activated CD4+ T cells revealed the presence of both, the stimulatory FcγRIIa (CD32a) and the inhibitory FcγRIIb (CD32b) isoforms of CD32, being the CD32a:CD32b mRNA ratio ~5:1. Consistent with this finding, we found not only that CD4+ T cells bind aggregated IgG, used as an IC model, but also that CD32 ligation by specific mAb induced a strong calcium transient in CD4+ T cells. Moreover, we found that pretreatment of CD4+ T cells with immobilized IgG as well as cross-linking of CD32 by specific antibodies increased both, the proliferative response of CD4+ T cells and the release of a wide pattern of cytokines (IL-2, IL-5, IL-10, IL-17, IFN-γ, and TNF-α) triggered by either PHA or anti-CD3 mAb. Collectively, our results indicate that ligation of CD32 promotes the activation of CD4+ T cells. These findings suggest that ICs might contribute to the perpetuation of chronic inflammatory responses by virtue of its ability to directly interact with CD4+ T cells through CD32a, promoting the activation of T cells into different inflammatory profiles.

Keywords: FcγR; IgG; T cells; activation; cytokines; proliferation.


Figures
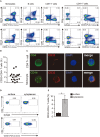
Figure 1
Figure 1
Analysis of CD32 expression in resting CD4+ T cells. (A) Representative dot plot of CD32 cell surface expression in monocytes (CD14+), B cells (CD19+), CD8+ and CD4+ T cells from a healthy adult donor using two different anti-CD32 mAb (FUN.2 and IV.3 clones) analyzed by flow cytometry. Surface isotype control labeling was set to stringent criteria. Results are expressed as percentages on PBMCs. (B) Frequency of CD32+ cells on gated CD4+ T cells from healthy adults using the FUN.2 clone mAb by flow cytometry. (C) Fluorescence microscopy of CD32 expression in purified CD4+ T cells and monocytes (green: CD4 or CD14, red: CD32). Nuclear counterstain with DAPI was used. Representative images are shown at x300. (D) Representative dot plot of cell surface and cytoplasmic CD32 expression in permeabilized resting CD4+ T cells. Surface and cytoplasmic isotype controls are shown. (E) Frequency of cell surface and cytoplasmic CD32 expression on resting CD4+ T cells. Results are expressed as percentages on CD4+ T cells. Representative experiments are shown in (A,C,D). Mean ± SEM of n donors are shown in (B) (n = 18) and (E) (n = 9). *p < 0.05. Wilcoxon matched-pairs signed rank test was used for analysis in (E).
Figure 2
Figure 2
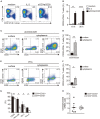
Activation of CD4+ T cells results in an increased expression of CD32. (A,B) PBMCs were cultured with medium (controls), IL-2 (20 ng/ml) or immobilized anti-CD3 (10 μg/ml) plus soluble anti-CD28 (1 mg/ml) (aCD3/aCD28) antibodies, during 18 or 36 h. The frequency of CD32+CD4+ T cells was analyzed by flow cytometry. (A) Representative dot plots of cell surface expression of CD32 in CD4+ T cells analyzed at 36 h of culture. Results are expressed as percentages on total lymphocytes. (B) Frequency of CD32+ cells on gated CD4+ T cells at 18 and 36 h of culture. (C–F) PBMCs were activated with either aCD3/aCD28 antibodies (C,D) or PHA (4 μg/ml, E,F) for 36 h. Then, cell surface or intracellular expression of CD32 was analyzed. Cell surface expression of CD25 was also assessed. Cytoplasmic isotype control is shown in (C,E). (G) Cell frequency of the different markers analyzed in CD32+CD4+ and CD32-CD4+ T cells. Results are expressed as percentage on each CD4+ T cell subset analyzed. (H) CD32a/CD32b mRNA ratio in activated CD32-CD4+ and CD32+CD4+ T cell subsets analyzed by qRT-PCR. Representative experiments are shown in (A,C,E). Mean ± SEM of n donors are shown in (B) (n = 7), (D) (n = 7), (F) (n = 7), (G) (n = 8), and (H) (n = 7). *p < 0.05, **p < 0.01, ****p < 0.0001. Kruskal–Wallis test followed by Dunn's multiple comparison was used for analysis in (B). Wilcoxon matched-pairs signed rank test was used for analysis in (D,F,G,H).
Figure 3
Figure 3
CD4+ T cells bind aIgG. (A) Resting or activated purified CD4+ T cells were incubated with aIgG (400 μg/ml) or serum-free medium for 2 h. Then, cells were washed and the binding of aIgG was analyzed by flow cytometry. (B) Activated CD4+ T cells were incubated with increasing concentrations of aIgG (50, 100, and 400 μg/ml) or serum-free medium. Data show the percentage of aIgG+CD4+ T cells. (C,D) Activated CD4+ T cells were treated with or without an anti-CD32 blocking antibody (IV.3 clone, 30 μg/ml) during 30 m. After washing, cells were incubated with 100 μg/ml of aIgG or serum-free medium. (C) Representative histograms of aIgG percentage are shown. (D) Percentage of aIgG+CD4+ T cells is shown. Representative experiments are shown in (A,C). Mean ± SEM of n donors are shown in (B) (n = 8) and (D) (n = 8). **p < 0.01, ***p < 0.001, ****p < 0.0001. Kruskal–Wallis test followed by Dunn's multiple comparison was used for analysis in (B). Mann–Whitney test was used for analysis in (D).
Figure 4
Figure 4
Stimulation through CD32 promotes the expansion of CD4+ T cells activated by suboptimal doses of different stimuli. (A) Purified CD4+ T cells labeled with fluo-3,AM fluorescent probe were treated with an anti-CD32 mAb (IV.3 clone) for 15 m. Then a F(ab′)2 fragment goat anti mouse IgG was added to induce the cross-linking of bound IV.3 mAb. Induction of cytosolic calcium transients was analyzed by flow cytometry at three different times: before and after addition of IV.3 and after stimulation with Fab′2 (upper panel). Cells were treated with ionomycin as a positive control (lower panel). A representative experiment is shown (n = 5). Geometric mean of fluo-3,AM vs. time is depicted. (B–E) Purified CD4+ T cells (1 × 10⁶) were cultured in the presence of medium (control), cIgG or IV.3 plus a Fab′2 antibody directed to mouse IgG, for 18 h. When IV.3 was used as blocking mAb, cells were pretreated with IV.3 clone, before being exposed to cIgG. Then, cells were stimulated with a suboptimal concentration of PHA (0.5 μg/ml, B,C) or anti-CD3 coated beads (0.025 μg/ml, D,E) and cultured for 5 d. Proliferative response was evaluated by using Ki-67 staining. (B–D) Representative dot plots of CD4 and Ki-67 staining are shown. Results are expressed as cell percentages on gated CD4+ T cells. (C–E) Percentage of Ki-67+CD4+ T cells analyzed by flow cytometry. Representative experiments are shown in (B,D). Mean ± SEM of n donors are shown in (C) (n = 10) and (E) (n = 6). *p < 0.05, **p < 0.01. Kruskal–Wallis test followed by Dunn's multiple comparison was used for analysis in (C,E).
Figure 5
Figure 5
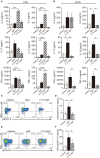
Stimulation through CD32 promotes the release of cytokines in CD4+ T cells activated by suboptimal doses of different stimuli. (A,B) Purified CD4+ T cells (1 × 10⁶) were cultured in the presence of medium (control, white bar), cIgG (black bar) or IV.3 plus a Fab′2 antibody directed to mouse IgG (striped bar), for 18 h. When IV.3 was used as blocking mAb, cells were pretreated with IV.3 clone, before being exposed to cIgG (gray bar). Then, cells were stimulated with a suboptimal concentration of PHA (0.5 μg/ml, A) or anti-CD3 (0.025 μg/ml, B) and cultured for 5 d. Levels of cytokines were quantified in the culture supernatant by ELISA. (C–F) Purified CD4+ T cells (1 × 10⁶) were cultured in the presence of medium or cIgG for 18 h. When IV.3 was used as blocking mAb, cells were pretreated with IV.3 clone, before being exposed to cIgG. Then, cells were stimulated with a suboptimal concentration of PHA (0.5 μg/ml) and cultured for 3 d. STAT5 (C,D) and STAT6 (E,F) phosphorylation was analyzed by flow cytometry. Results are expressed as percentage on CD4+ T cells. Representative experiments are shown in (C,E). The mean ± SEM of n experiments is shown in (A) (n = 10), (B) (n = 6), (D) (n = 5), and (F) (n = 5). *p < 0.05, **p < 0.01, ***p < 0.001, ****p < 0.0001. Mann–Whitney test was used for analysis in (A,B). Kruskal–Wallis test followed by Dunn's multiple comparison was used for analysis in (D,F).

Similar articles

Cited by

References

    1. Bournazos S, Chow SK, Abboud N, Casadevall A, Ravetch JV. Human IgG Fc domain engineering enhances antitoxin neutralizing antibody activity. J Clin Invest. (2014) 124:725–9. 10.1172/JCI72676 - DOI - PMC - PubMed
    1. Pincetic A, Bournazos S, DiLillo DJ, Maamary J, Wang TT, Dahan R, et al. . Type I and type II Fc receptors regulate innate and adaptive immunity. Nat Immunol. (2014) 15:707–16. 10.1038/ni.2939 - DOI - PMC - PubMed
    1. Amigorena S, Bonnerot C, Drake JR, Choquet D, Hunziker W, Guillet JG, et al. . Cytoplasmic domain heterogeneity and functions of IgG Fc receptors in B lymphocytes. Science (1992) 256:1808–12. - PubMed
    1. Swanson JA, Hoppe AD. The coordination of signaling during Fc receptor-mediated phagocytosis. J Leukoc Biol. (2004) 76:1093–103. 10.1189/jlb.0804439 - DOI - PubMed
    1. Muta T, Kurosaki T, Misulovin Z, Sanchez M, Nussenzweig MC, Ravetch JV. A 13-amino-acid motif in the cytoplasmic domain of Fc gamma RIIB modulates B-cell receptor signalling. Nature (1994) 369:340. 10.1038/369340a0 - DOI - PubMed

Publication types