

Mortality, morbidity, and hospitalisations due to influenza lower respiratory tract infections, 2017: an analysis for the Global Burden of Disease Study 2017
- PMID: 30553848
- PMCID: PMC6302221
- DOI: 10.1016/S2213-2600(18)30496-X
Mortality, morbidity, and hospitalisations due to influenza lower respiratory tract infections, 2017: an analysis for the Global Burden of Disease Study 2017
Abstract
Background: Although the burden of influenza is often discussed in the context of historical pandemics and the threat of future pandemics, every year a substantial burden of lower respiratory tract infections (LRTIs) and other respiratory conditions (like chronic obstructive pulmonary disease) are attributable to seasonal influenza. The Global Burden of Disease Study (GBD) 2017 is a systematic scientific effort to quantify the health loss associated with a comprehensive set of diseases and disabilities. In this Article, we focus on LRTIs that can be attributed to influenza.
Methods: We modelled the LRTI incidence, hospitalisations, and mortality attributable to influenza for every country and selected subnational locations by age and year from 1990 to 2017 as part of GBD 2017. We used a counterfactual approach that first estimated the LRTI incidence, hospitalisations, and mortality and then attributed a fraction of those outcomes to influenza.
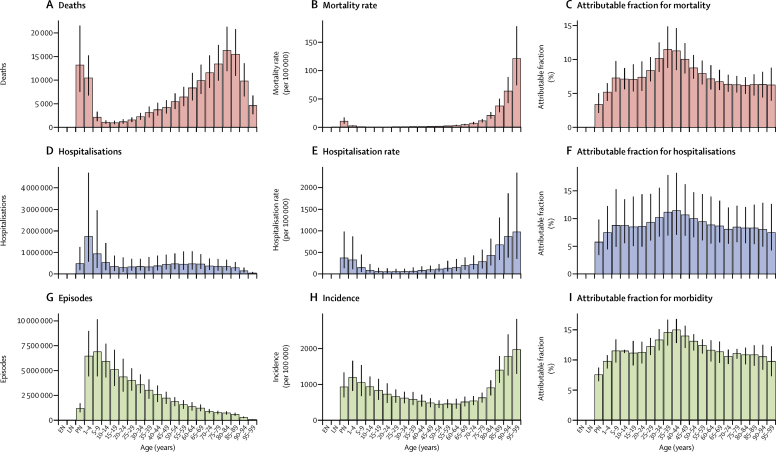
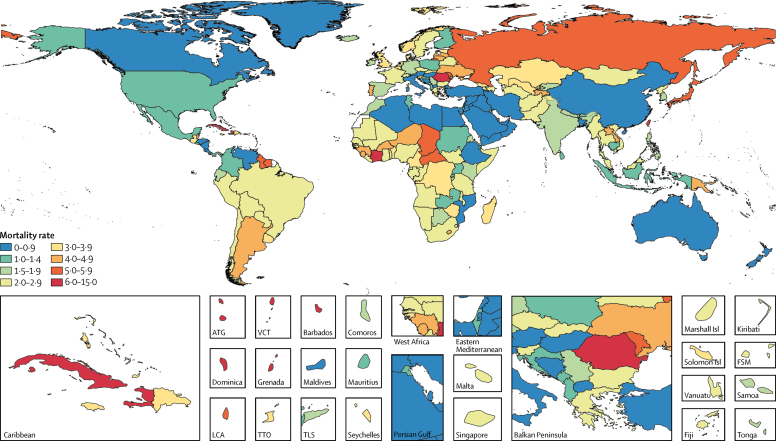
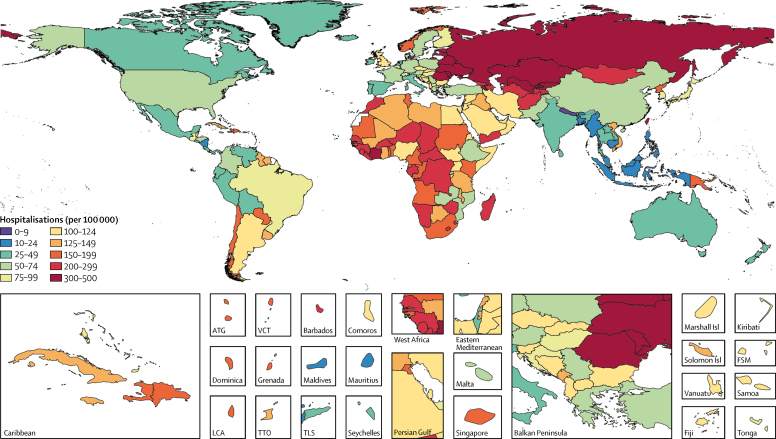
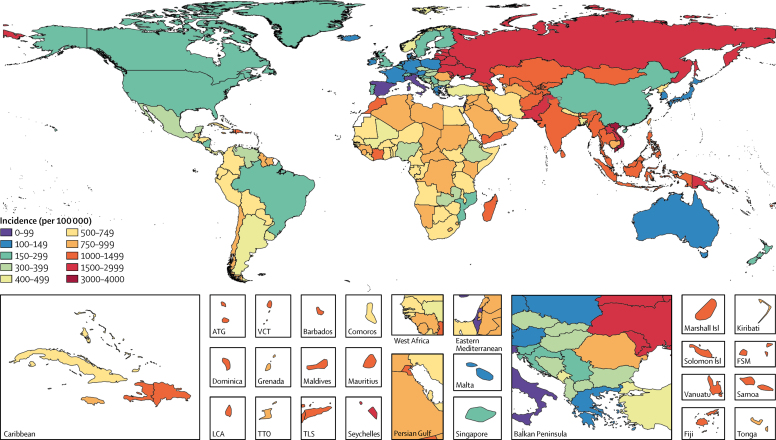
Findings: Influenza LRTI was responsible for an estimated 145 000 (95% uncertainty interval [UI] 99 000-200 000) deaths among all ages in 2017. The influenza LRTI mortality rate was highest among adults older than 70 years (16·4 deaths per 100 000 [95% UI 11·6-21·9]), and the highest rate among all ages was in eastern Europe (5·2 per 100 000 population [95% UI 3·5-7·2]). We estimated that influenza LRTIs accounted for 9 459 000 (95% UI 3 709 000-22 935 000) hospitalisations due to LRTIs and 81 536 000 hospital days (24 330 000-259 851 000). We estimated that 11·5% (95% UI 10·0-12·9) of LRTI episodes were attributable to influenza, corresponding to 54 481 000 (38 465 000-73 864 000) episodes and 8 172 000 severe episodes (5 000 000-13 296 000).
Interpretation: This comprehensive assessment of the burden of influenza LRTIs shows the substantial annual effect of influenza on global health. Although preparedness planning will be important for potential pandemics, health loss due to seasonal influenza LRTIs should not be overlooked, and vaccine use should be considered. Efforts to improve influenza prevention measures are needed.
Funding: Bill & Melinda Gates Foundation.
Copyright © 2019 The Author(s). Published by Elsevier Ltd. This is an Open Access article under the CC BY 4.0 license. Published by Elsevier Ltd.. All rights reserved.
Figures
Comment in
-
Reconciling estimates of the global influenza burden.Lancet Respir Med. 2019 Jan;7(1):8-9. doi: 10.1016/S2213-2600(18)30511-3. Epub 2018 Dec 12. Lancet Respir Med. 2019. PMID: 30553846 No abstract available.
Similar articles
-
Global, regional, and national incidence and mortality burden of non-COVID-19 lower respiratory infections and aetiologies, 1990-2021: a systematic analysis from the Global Burden of Disease Study 2021.Lancet Infect Dis. 2024 Sep;24(9):974-1002. doi: 10.1016/S1473-3099(24)00176-2. Epub 2024 Apr 15. Lancet Infect Dis. 2024. PMID: 38636536 Free PMC article.
-
Estimates of the global, regional, and national morbidity, mortality, and aetiologies of lower respiratory infections in 195 countries, 1990-2016: a systematic analysis for the Global Burden of Disease Study 2016.Lancet Infect Dis. 2018 Nov;18(11):1191-1210. doi: 10.1016/S1473-3099(18)30310-4. Epub 2018 Sep 19. Lancet Infect Dis. 2018. PMID: 30243584 Free PMC article.
-
Age-sex differences in the global burden of lower respiratory infections and risk factors, 1990-2019: results from the Global Burden of Disease Study 2019.Lancet Infect Dis. 2022 Nov;22(11):1626-1647. doi: 10.1016/S1473-3099(22)00510-2. Epub 2022 Aug 11. Lancet Infect Dis. 2022. PMID: 35964613 Free PMC article.
-
Global burden of respiratory infections due to seasonal influenza in young children: a systematic review and meta-analysis.Lancet. 2011 Dec 3;378(9807):1917-30. doi: 10.1016/S0140-6736(11)61051-9. Epub 2011 Nov 10. Lancet. 2011. PMID: 22078723 Review.
-
Global, regional, and national disease burden estimates of acute lower respiratory infections due to respiratory syncytial virus in children younger than 5 years in 2019: a systematic analysis.Lancet. 2022 May 28;399(10340):2047-2064. doi: 10.1016/S0140-6736(22)00478-0. Epub 2022 May 19. Lancet. 2022. PMID: 35598608 Free PMC article. Review.
Cited by
-
Ventilation does not affect close-range transmission of influenza virus in a ferret playpen setup.Proc Natl Acad Sci U S A. 2024 Aug 13;121(33):e2322660121. doi: 10.1073/pnas.2322660121. Epub 2024 Aug 6. Proc Natl Acad Sci U S A. 2024. PMID: 39361828 Free PMC article.
-
Respiratory pathogen dynamics in community fever cases: Jiangsu Province, China (2023-2024).Virol J. 2024 Sep 20;21(1):226. doi: 10.1186/s12985-024-02494-9. Virol J. 2024. PMID: 39304902 Free PMC article.
-
Global Seasonal Influenza Mortality Estimates: A Comparison of 3 Different Approaches.Am J Epidemiol. 2021 May 4;190(5):718-727. doi: 10.1093/aje/kwaa196. Am J Epidemiol. 2021. PMID: 32914184 Free PMC article.
-
Rhinovirus/enterovirus was the most common respiratory virus detected in adults with severe acute respiratory infections pre-COVID-19 in Kuala Lumpur, Malaysia.PLoS One. 2022 Sep 2;17(9):e0273697. doi: 10.1371/journal.pone.0273697. eCollection 2022. PLoS One. 2022. PMID: 36054088 Free PMC article.
-
Review of influenza-associated pulmonary aspergillosis in ICU patients and proposal for a case definition: an expert opinion.Intensive Care Med. 2020 Aug;46(8):1524-1535. doi: 10.1007/s00134-020-06091-6. Epub 2020 Jun 22. Intensive Care Med. 2020. PMID: 32572532 Free PMC article.
References
-
- Murray CJ, Lopez AD, Chin B, Feehan D, Hill KH. Estimation of potential global pandemic influenza mortality on the basis of vital registry data from the 1918–20 pandemic: a quantitative analysis. Lancet. 2006;368:2211–2218. - PubMed
-
- Oxford JS. Influenza A pandemics of the 20th century with special reference to 1918: virology, pathology and epidemiology. Rev Med Virol. 2000;10:119–133. - PubMed
-
- GBD 2016 Lower Respiratory Infections Collaborators Estimates of the global, regional, and national morbidity, mortality, and aetiologies of lower respiratory infections in 195 countries: a systematic analysis for the Global Burden of Disease Study 2016. Lancet Infect Dis. 2018;18:1191–1210. - PMC - PubMed
-
- Fineberg HV. Pandemic preparedness and response—lessons from the H1N1 influenza of 2009. N Engl J Med. 2014;370:1335–1342. - PubMed
