

FGFR1 regulates trophectoderm development and facilitates blastocyst implantation
- PMID: 30552867
- PMCID: PMC6370302
- DOI: 10.1016/j.ydbio.2018.12.008
FGFR1 regulates trophectoderm development and facilitates blastocyst implantation
Abstract
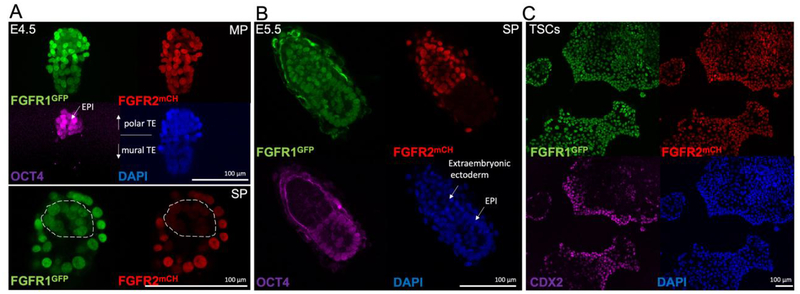
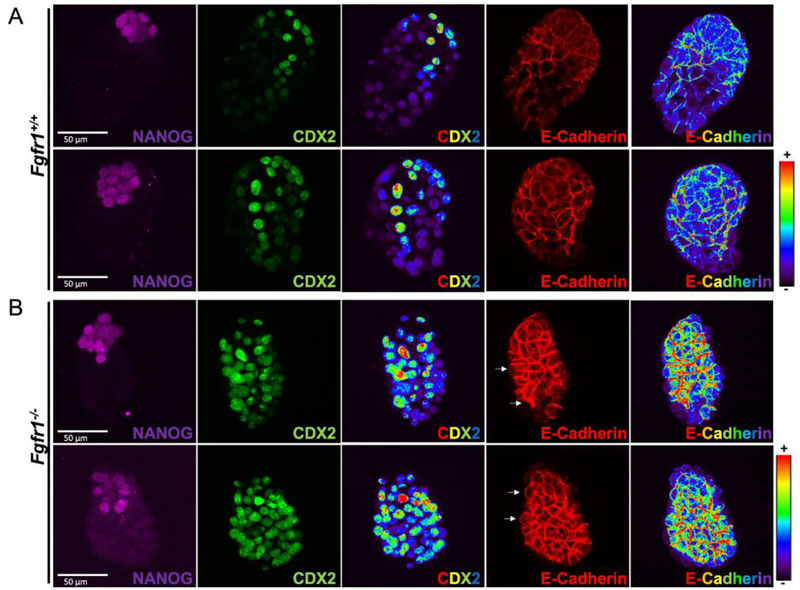
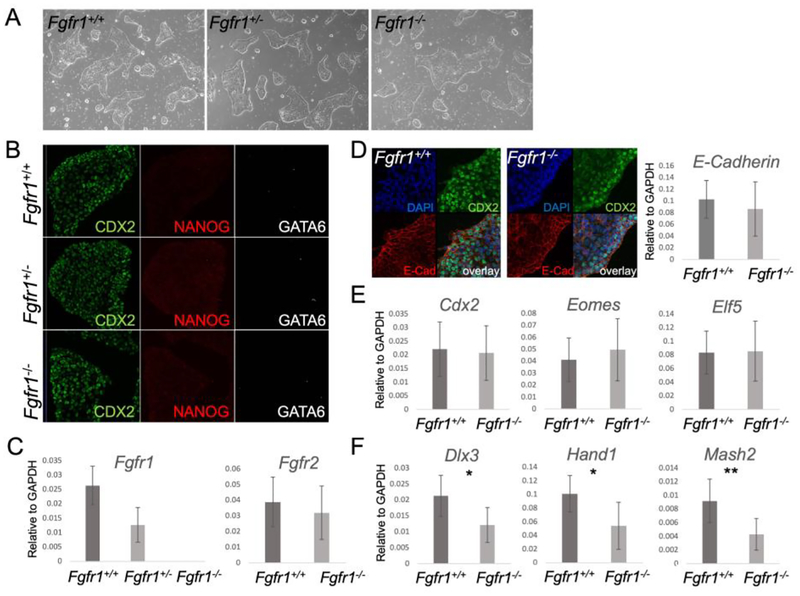
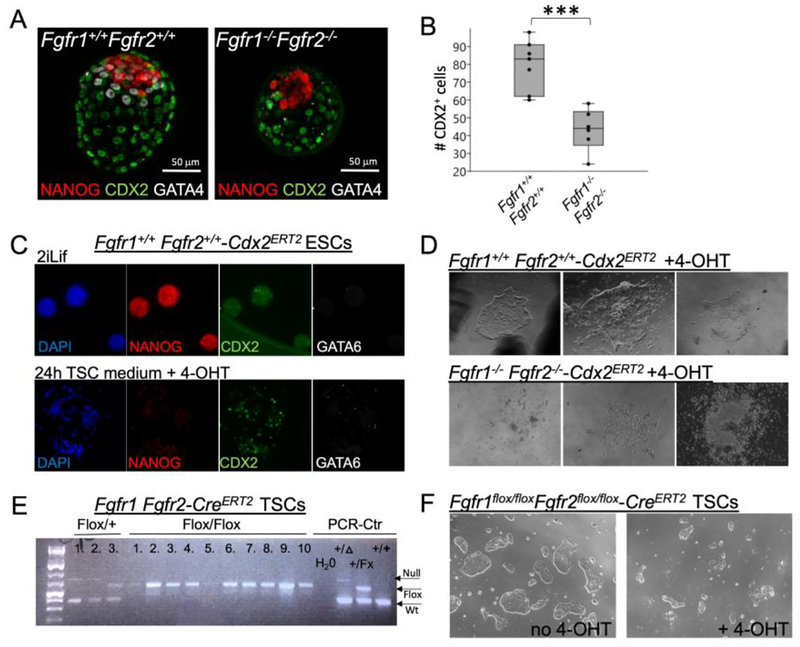
FGF signaling plays important roles in many aspects of mammalian development. Fgfr1-/- and Fgfr1-/-Fgfr2-/- mouse embryos on a 129S4 co-isogenic background fail to survive past the peri-implantation stage, whereas Fgfr2-/- embryos die at midgestation and show defects in limb and placental development. To investigate the basis for the Fgfr1-/- and Fgfr1-/-Fgfr2-/- peri-implantation lethality, we examined the role of FGFR1 and FGFR2 in trophectoderm (TE) development. In vivo, Fgfr1-/- TE cells failed to downregulate CDX2 in the mural compartment and exhibited abnormal apicobasal E-Cadherin polarity. In vitro, we were able to derive mutant trophoblast stem cells (TSCs) from Fgfr1-/- or Fgfr2-/- single mutant, but not from Fgfr1-/-Fgfr2-/- double mutant blastocysts. Fgfr1-/- TSCs however failed to efficiently upregulate TE differentiation markers upon differentiation. These results suggest that while the TE is specified in Fgfr1-/- mutants, its differentiation abilities are compromised leading to defects at implantation.
Keywords: FGF; TS cells; Trophectoderm.
Copyright © 2018 Elsevier Inc. All rights reserved.
Figures


Similar articles
-
Developmental differences in the expression of FGF receptors between human and mouse embryos.Placenta. 2014 Dec;35(12):1079-88. doi: 10.1016/j.placenta.2014.09.008. Epub 2014 Sep 23. Placenta. 2014. PMID: 25443433
-
Analysis of human embryos from zygote to blastocyst reveals distinct gene expression patterns relative to the mouse.Dev Biol. 2013 Mar 1;375(1):54-64. doi: 10.1016/j.ydbio.2012.12.008. Epub 2012 Dec 19. Dev Biol. 2013. PMID: 23261930
-
GATA3 is selectively expressed in the trophectoderm of peri-implantation embryo and directly regulates Cdx2 gene expression.J Biol Chem. 2009 Oct 16;284(42):28729-37. doi: 10.1074/jbc.M109.016840. Epub 2009 Aug 21. J Biol Chem. 2009. PMID: 19700764 Free PMC article.
-
The unknown human trophectoderm: implication for biopsy at the blastocyst stage.J Assist Reprod Genet. 2020 Nov;37(11):2699-2711. doi: 10.1007/s10815-020-01925-0. Epub 2020 Sep 6. J Assist Reprod Genet. 2020. PMID: 32892265 Free PMC article. Review.
-
Unlocking trophectoderm mysteries: In vivo and in vitro perspectives on human and mouse trophoblast fate induction.Dev Cell. 2024 Apr 22;59(8):941-960. doi: 10.1016/j.devcel.2024.03.029. Dev Cell. 2024. PMID: 38653193 Review.
Cited by
-
Self-organized signaling in stem cell models of embryos.Stem Cell Reports. 2021 May 11;16(5):1065-1077. doi: 10.1016/j.stemcr.2021.03.020. Stem Cell Reports. 2021. PMID: 33979594 Free PMC article. Review.
-
Live Visualization of ERK Activity in the Mouse Blastocyst Reveals Lineage-Specific Signaling Dynamics.Dev Cell. 2020 Nov 9;55(3):341-353.e5. doi: 10.1016/j.devcel.2020.09.030. Epub 2020 Oct 21. Dev Cell. 2020. PMID: 33091370 Free PMC article.
-
Diverse Fgfr1 signaling pathways and endocytic trafficking regulate mesoderm development.Genes Dev. 2024 Jun 25;38(9-10):393-414. doi: 10.1101/gad.351593.124. Genes Dev. 2024. PMID: 38834239 Free PMC article.
-
Genome-wide assessment of DNA methylation in mouse oocytes reveals effects associated with in vitro growth, superovulation, and sexual maturity.Clin Epigenetics. 2019 Dec 19;11(1):197. doi: 10.1186/s13148-019-0794-y. Clin Epigenetics. 2019. PMID: 31856890 Free PMC article.
-
FGF signaling regulates development by processes beyond canonical pathways.Genes Dev. 2020 Dec 1;34(23-24):1735-1752. doi: 10.1101/gad.342956.120. Epub 2020 Nov 12. Genes Dev. 2020. PMID: 33184218 Free PMC article.
References
-
- Chazaud C, Yamanaka Y, Pawson T, Rossant J, 2006. Early lineage segregation between epiblast and primitive endoderm in mouse blastocysts through the Grb2-MAPK pathway. Dev Cell 10, 615–624. - PubMed
Publication types
MeSH terms
Substances
Grants and funding
LinkOut - more resources
Full Text Sources
Other Literature Sources
Molecular Biology Databases
Miscellaneous
