. 2018 Dec 14;9(1):5313.
doi: 10.1038/s41467-018-07662-4.

TGNap1 is required for microtubule-dependent homeostasis of a subpopulation of the plant trans-Golgi network

Affiliations

TGNap1 is required for microtubule-dependent homeostasis of a subpopulation of the plant trans-Golgi network

Luciana Renna et al. Nat Commun. .

Abstract

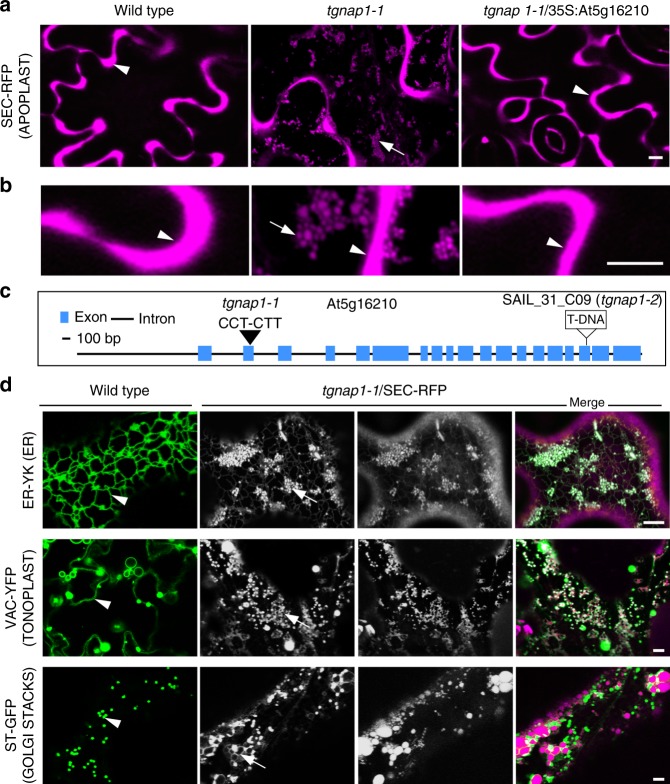
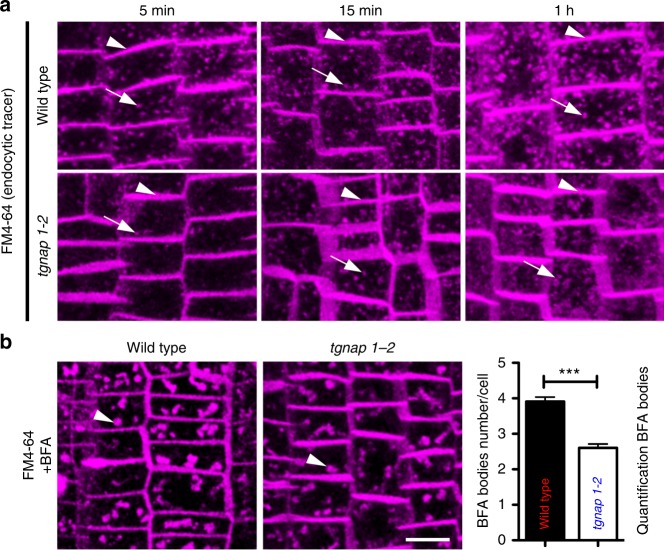
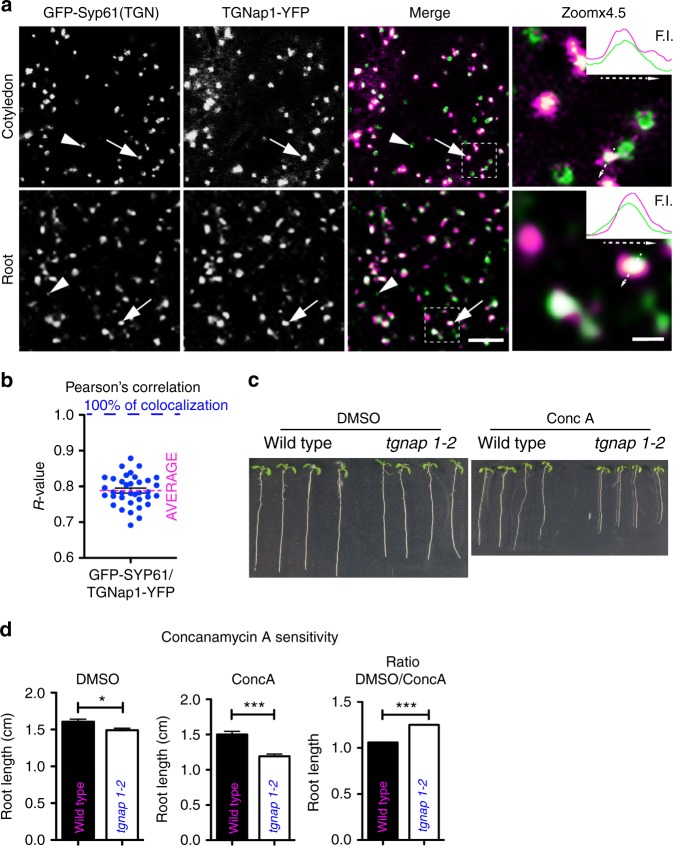
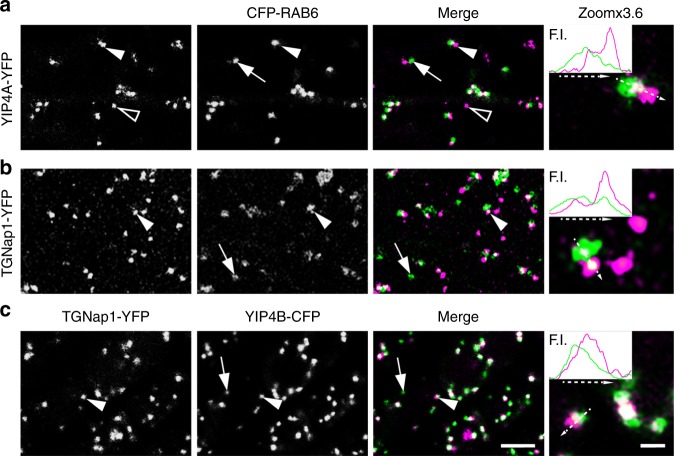
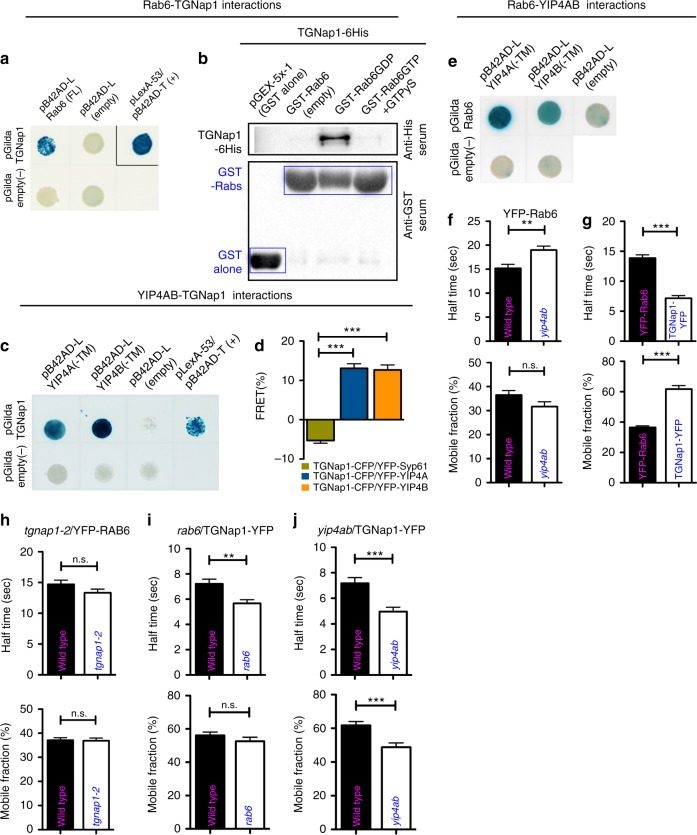
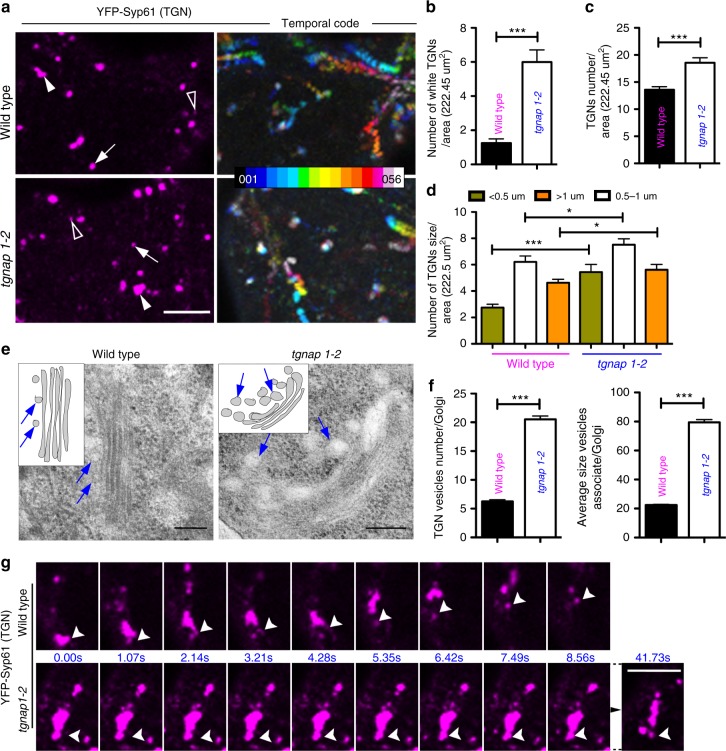
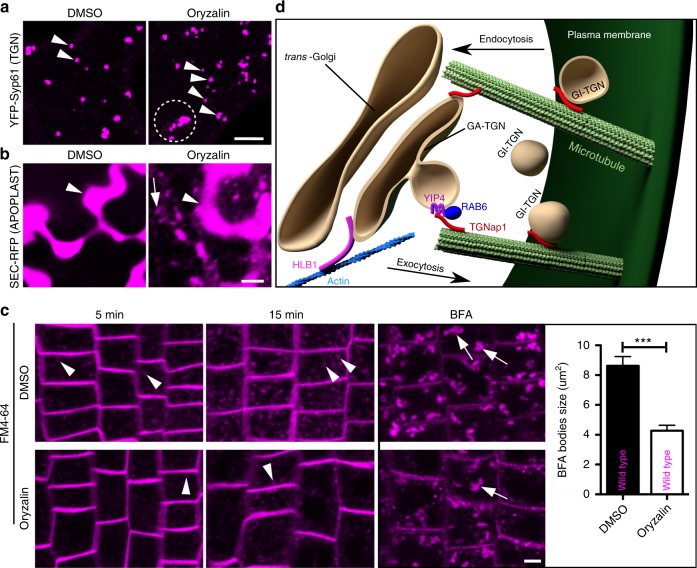
Defining convergent and divergent mechanisms underlying the biogenesis and function of endomembrane organelles is fundamentally important in cell biology. In all eukaryotes, the Trans-Golgi Network (TGN) is the hub where the exocytic and endocytic pathways converge. To gain knowledge in the mechanisms underlying TGN biogenesis and function, we characterized TGNap1, a protein encoded by a plant gene of unknown function conserved with metazoans. We demonstrate that TGNap1 is a TGN protein required for the homeostasis of biosynthetic and endocytic traffic pathways. We also show that TGNap1 binds Rab6, YIP4 and microtubules. Finally, we establish that TGNap1 contributes to microtubule-dependent biogenesis, tracking and function of a TGN subset, likely through interaction with Rab6 and YIP4. Our results identify an important trafficking determinant at the plant TGN and reveal an unexpected reliance of post-Golgi traffic homeostasis and organelle biogenesis on microtubules in plants.


Conflict of interest statement

The authors declare no competing interests.

Figures

Fig. 1
Fig. 1
Identification, subcellular phenotypes, and mapping of tgnap1–1. a Live-cell confocal images of cotyledon epidermal cells SEC-RFP (magenta) showing distribution in the extracellular environment (apoplast, arrowheads) in WT and complemented tgnap1–1, but partial retention in intracellular globular structures in tgnap1–1 (arrows). b Magnified views of the cellular structures presented in a. c Genomic structure of TGNap1 (At5g16210). d Confocal images of cells of WT and tgnap1–1/SEC-RFP expressing markers for the ER network (arrowhead; ER-YK), vacuole membrane (arrowhead; VAC-YFP) and Golgi stacks (arrowhead; ST-GFP) (grayscale). Merged panels show in green and magenta, respectively, the endomembrane markers and SEC-RFP marker in tgnap1–1. In tgnap1–1, these markers are found also surrounding the aberrant SEC-RFP structures indicated by arrows. Scale bars = 5 µm
Fig. 2
Fig. 2
TGNap1 is required for endocytosis homeostasis. a Max intensity projections of serial confocal images (depth: 35 µm) of WT and tgnap1–2 primary root cells at 5 min, 15 min, and 1 h after labeling with FM4–64. Arrowheads: FM4–64 at the PM; arrows: FM4–64 at the endosomes. b Confocal images of BFA bodies (arrowheads) in WT and tgnap1–2 cells labeled with FM4–64 for 5 min. Graph indicates the number of BFA bodies/cell. WT cells (n = 105), tgnap1–2 cells (n = 125). Scale bars = 5 µm. Error bars indicate S.E.M; Student t-test was applied, p-values are represented by asterisks when significantly different from the corresponding control: **0.001 > p < 0.01; ***p < 0.001. Source data are provided as a Source Data file
Fig. 3
Fig. 3
TGNap1 is a functional TGN protein. a Confocal images of epidermal cells coexpressing GFP-Syp61 and TGNap1-YFP (respectively, green and magenta, in white overlapping regions, single panels in grayscale). Arrows: TGNs positive for both GFP-Syp61 and TGNap1-YFP; arrowheads: Syp61-positive TGNs devoid of TGNap1-YFP signal. Scale bar = 5 µm. Zoomx4.5 panels: 4.5x magnification of the regions marked in merge (white dashed lines). Scale bar = 1 µm. Insets: intensity profile (F.I.) measurements for GFP-Syp61 (green) and TGNap1-YFP (magenta) along the arrow on individual TGNs, indicating non-complete overlap of the two signals. b Pearson’s correlation coefficient (R-value: 78.85%; n = 36). c Images of WT and tgnap1–2 seedlings grown on DMSO or 50 nM ConcA-containing media. d Primary root length and relative ratio. Measurements from three independent experiments. Error bars indicate S.E.M; Student t-test was applied, p-values are represented by asterisks when significantly different from the corresponding control: *0.01 > p < 0.05; ***p < 0.001. Source data provided as a Source Data file
Fig. 4
Fig. 4
TGNap1 partially colocalizes with Rab6 and YIP4 at the TGN. a Confocal images of cotyledon epidermal cells expressing YIP4A-YFP and CFP-Rab6 showing co-distribution to the same organelles (arrowheads) or distinct organelles (arrow: Rab6-only positive organelle, likely Golgi stack (see Supplementary Fig. 7); empty arrow: YIP4A-only positive organelle). Insets: line intensity profile (F.I.) along the arrow on the TGN structure. Scale bars = 5 µm (main images), 1 µm (zoomed panels.) b, c Confocal images of cotyledon epidermal cells expressing TGNap1-YFP and either CFP-Rab6 (b) or YIP4B-CFP (c) showing a shifted distribution of TGNap1 vs. either Rab6 or YIP4 (arrowheads). Magnification is presented in Zoomx3.6 panels. Insets: line fluorescent intensity profile (F.I.) along the arrows with dashed lines drawn on TGN. Arrows: Rab6 (b) or YIP4 not colocalizing structures with TGNap1-YFP (c)
Fig. 5
Fig. 5
TGNAp1, RAB6, and YIP4A and B interactions and dynamics. a Y2H assay between TGNap1 and Rab6 (blue colonies: positive interaction, white colonies: negative controls). b Western blot on pull-down analyses between TGNap1 and Rab6 (anti-GST lanes: loading control). c Y2H assay between TGNap1 with YIP4A and YIP4B. d FRET analyses between TGNap1-CFP and either YFP-Syp61 (negative control) (n = 47) or YFP-YIP4A (n = 39), and YFP-YIP4B (n = 46) at the TGNs. e Y2H assay between Rab6 with YIP4A and YIP4B. f FRAP analyses on YFP-Rab6 in WT (n = 46) and yip4ab (n = 51). g FRAP analyses on TGNap1-YFP (n = 58; half-time = 7.18 ± 0.43) and YFP-Rab6 (n = 59; half-time = 15.18 ± 0.85). n = number of independent data points. h FRAP analyses on YFP-Rab6 in WT and tgnap1–2 showing no significant differences in the dynamics in the two backgrounds, respectively: n = 55; half-time = 14.69 ± 0.70 and n = 55; half-time = 13.32 ± 0.60. i FRAP analyses on TGNap1-YFP in WT and rab6. In WT, TGNap1-YFP cycles on and off the TGN membranes with a half-time = 7.21 ± 0.38 (n = 49); however, when the cellular abundance of RAB6 is reduced compared to WT, TGNap1-YFP cycles at a significantly higher rate (n =52; half-time = 5.67± 0.29). j FRAP analyses on TGNap1-YFP in WT and yip4ab show a significant increase in the cycling of TGNap1-YFP on and off the TGN membranes when YIP4 is not available (n = 47; half-time = 4.96 ± 0.34) compared to WT (n = 59; half-time = 7.18 ± 0.43). Error bars indicate S.E.M; Student t-test was applied, p-values are represented by asterisks when significantly different from the corresponding control: ***p < 0.001; **0.001 > p < 0.01; n.s., not significant. Source data are provided as a Source Data file
Fig. 6
Fig. 6
TGNap1 is a MT-binding protein. a TGNap1 protein domains showing LisH and coiled coil (CC) domains. Numbers indicate domain positions and total protein length (AA: amino acid residues). TGNap1-T indicates the LisH domain-containing region used for the interaction assay presented in b. b MT sedimentation assay with recombinant TGNap1T-His and bovine brain MT showing that TGNap1 is in supernatant in the absence of MT (S), and precipitates in the pellet (P) in the presence of MT. The graph represents the soluble/ pellet ratio of the mean three measurements value for TGNap1 protein band intensity. c Images extracted from confocal microscopy time-lapse (see Supplementary Movie 1) acquired on cotyledon epidermal cells coexpressing TGNap1-YFP (magenta) and CFP-Tua6 (green). Arrowheads point to one TGN that was tracked overtime showing a continuous association with MT. Zoomed image shows a close-up of the same TGN; arrowheads indicate points of contact of the TGN with MT. Scale bars = 5 µm (main images); 1 µm in zoomed image. Student t-test was applied, p-values are represented by asterisks when significantly different from the corresponding control: ***p < 0.001; **0.001 > p < 0.01; n.s., not significant. Source data is provided as a Source Data file
Fig. 7
Fig. 7
Streaming and biogenesis of a TGNs subset requires TGNap1. a Confocal images of YFP-Syp61-positive TGNs in cotyledon epidermal cells of either WT or tgnap1–2. Images are either single (left panels in magenta) or compound (right panels, color gradient images). In single images, arrowheads, arrows, and empty arrowheads indicate large, medium, and small TGNs, respectively. Compound panels are composite of 56 frames each pseudocolored along a color gradient (see scale) captured at 1.05 s interval. White color (last frame) overlapping other colors denotes slow mobility of the TGNs. Scale bar = 5 µm. b Quantification of the number of YFP-Syp61 TGNs pseudocolored white in cotyledon epidermal cells of either WT or tgnap1–2 background (Student t-test was applied). c Quantification of the number of total YFP-Syp61 TGNs in cotyledon epidermal cells in WT and tgnap1–2 background, expressed as number of white TGNs/222.5 µm2 area (n = 50 areas/genotype). d Size distribution of YFP-Syp61 TGNs in cotyledon epidermal cells of either WT or tgnap1–2 (n = 50 areas/genotype) (p-value calculated with one-way Anova with Tukey’s post test). e Transmission electron micrographs of Golgi and TGNs (arrows) in WT and tgnap1–2 roots. Insets: diagrams representing TGN-GA structures identified in the images. Scale bars = 0.2 µm. f Quantification of number and size of GA-TGN vesicles/Golgi (n = 60). Error bars: S.E.M. *** = p < 0.001 (Student t-test was applied, p-values are represented by asterisks when significantly different from the corresponding control). Number of Golgi analyzed = 60. g Frames from time-lapse microscopy (see Supplementary Movie 2A, B) of YFP-Syp61 labeled TGNs in cotyledon epidermal cells of WT and tgnap1–2 background showing GI-TGNs biogenesis (arrowheads) over time. Numbers between panels express the time (seconds). Note the delay of GI-TGN detachment in tgnap1–2 compared to WT. Scale bar = 1 µm. Source data is provided as a Source Data file
Fig. 8
Fig. 8
The loss of MT phenocopies the tgnap1 subcellular phenotypes. a Confocal images of TGNs labeled by YFP-Syp61 in WT cotyledon epidermal cells untreated (DMSO) or treated with oryzalin 10 µm for 7 h showing appearance of small TGNs (arrowheads) and clustered TGNs (circled with dotted line) in the treated sample compared to the untreated one. b Effect of oryzalin treatment on cotyledon epidermal cells expressing SEC-RFP. The marker is in the apoplast (arrowheads) in untreated and treated cells, but also accumulates in intracellular structures (arrow) in treated cells. c Internalization of FM4–64 in WT root cells untreated (DMSO) or treated with oryzalin at 5 min and 15 min. Arrowheads indicate endosomes. Arrows in confocal images indicate BFA bodies, graph indicates BFA bodies size in oryzalin untreated and treated WT plants. WT untreated (DMSO) BFA bodies (n = 100), WT treated (oryzalin) BFA bodies (n = 80). Scale bars = 5 µm. Error bars indicate S.E.M. Student t-test was applied, p-values are represented by asterisks when significantly different from the corresponding control *** = p < 0.001. d Model for a role of TGNap1 at the TGN. TGNap1 associates to subdomains of a subpopulation of TGNs in plant cells, where it influences biogenesis and function of the TGN as well as the movement of GI-TGN/secretory vesicles through MT. The role of TGNap1 in exocytosis involves Rab6 and YIP4, either as a ternary complex or through sequential protein–protein interactions, but its role in endocytosis is likely independent from YIP4, given the lack of a requirement of YIP4 in endocytosis. Schematic models were made and rendered in the 3D rendering application, Blender (www.blender.org), and further modified (addition of text and formatted for publication) using the vector-graphics editor Inkscape (inkscape.org)

Similar articles

Cited by

References

    1. Dettmer J, Hong-Hermesdorf A, Stierhof YD, Schumacher K. Vacuolar H+-ATPase activity is required for endocytic and secretory trafficking in Arabidopsis. Plant Cell. 2006;18:715–730. doi: 10.1105/tpc.105.037978. - DOI - PMC - PubMed
    1. Scheuring D, et al. Multivesicular bodies mature from the trans-golgi network/early endosome in Arabidopsis. Plant Cell. 2011;23:3463–3481. doi: 10.1105/tpc.111.086918. - DOI - PMC - PubMed
    1. Kang BH, Staehelin LA. ER-to-Golgi transport by COPII vesicles in Arabidopsis involves a ribosome-excluding scaffold that is transferred with the vesicles to the Golgi matrix. Protoplasma. 2008;234:51–64. doi: 10.1007/s00709-008-0015-6. - DOI - PubMed
    1. Uemura T, Suda Y, Ueda T, Nakano A. Dynamic behavior of the trans-golgi network in root tissues of Arabidopsis revealed by super-resolution live imaging. Plant Cell Physiol. 2014;55:694–703. doi: 10.1093/pcp/pcu010. - DOI - PubMed
    1. Sparks JA, et al. HLB1 is a tetratricopeptide repeat domain-containing protein that operates at the intersection of the exocytic and endocytic pathways at the TGN/EE in Arabidopsis. Plant Cell. 2016;28:746–769. doi: 10.1105/tpc.15.00794. - DOI - PMC - PubMed

Publication types