. 2018 Dec 14:7:e42955.
doi: 10.7554/eLife.42955.

Genetic analysis reveals functions of atypical polyubiquitin chains

Affiliations

Genetic analysis reveals functions of atypical polyubiquitin chains

Fernando Meza Gutierrez et al. Elife. .

Abstract

Although polyubiquitin chains linked through all lysines of ubiquitin exist, specific functions are well-established only for lysine-48 and lysine-63 linkages in Saccharomyces cerevisiae. To uncover pathways regulated by distinct linkages, genetic interactions between a gene deletion library and a panel of lysine-to-arginine ubiquitin mutants were systematically identified. The K11R mutant had strong genetic interactions with threonine biosynthetic genes. Consistently, we found that K11R mutants import threonine poorly. The K11R mutant also exhibited a strong genetic interaction with a subunit of the anaphase-promoting complex (APC), suggesting a role in cell cycle regulation. K11-linkages are important for vertebrate APC function, but this was not previously described in yeast. We show that the yeast APC also modifies substrates with K11-linkages in vitro, and that those chains contribute to normal APC-substrate turnover in vivo. This study reveals comprehensive genetic interactomes of polyubiquitin chains and characterizes the role of K11-chains in two biological pathways.

Keywords: APC; K11; S. cerevisiae; biochemistry; chemical biology; genetics; genomics; ubiquitin.


Conflict of interest statement

FM, AM, AD, HB, JJ, JX, MS, MN, RT, CP, LS, NK, DT No competing interests declared, DS is affiliated with Amgen Research. The author has no other competing interests to declare.

Figures
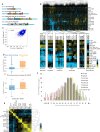
Figure 1.
Figure 1.. The ubiquitin linkage SGA reveals the genetic interactome of polyubiquitin chain types and functional relationships between lysines of ubiquitin.
(A) UBI1-UBI4 were modified to express lysine to arginine mutant ubiquitin alleles under the control of the constitutive GPD promoter. Ribosomal proteins, which are normally encoded at UBI1-UBI3, were also placed under the control of the GPD promoter individually, or as ubiquitin-fusions. (B) Top: A clustered heat map of quantitative genetic interactions between ubiquitin K-to-R mutants and an array of single gene deletions. Each K-to-R is expressed as the only ubiquitin present in the cell, except for K48R, which is lethal and was therefore co-expressed with WT ubiquitin (20% of total). As indicated in the adjacent color legend, blue pixels represent negative genetic interaction scores, yellow pixels represent positive genetic interaction scores, and black pixels indicate no interaction. Grey pixels represent interactions displaying extremely low signal, which could represent either strong negative interactions or pinning errors. Bottom: Unbiased hierarchical clustering identifies known gene modules. Named genes are part of the complexes or pathways listed (bold), or have related functions. (C) Scatter plot comparing the genetic interaction scores in two biological replicates of the ubiquitin SGA. The correlation coefficient between the two replicates was calculated. (D) The correlation of genetic interaction profiles of physically interacting or non-interacting gene pairs in the ubiquitin SGA and the chromosome biology E-MAP (Collins et al., 2007). (E) The correlation between the genetic interactomes of K-to-R ubiquitin mutants is shown as a heat map of correlation coefficients, and a dendogram showing hierarchical clustering. As the color legend indicates, correlation coefficient values of 1 are shown as yellow pixels, while values of −1 are shown as blue pixels. (F) A histogram showing the frequencies (Log2) of genetic interactions with the indicated S-scores for each single K-to-R ubiquitin mutant.
Figure 1—figure supplement 1.
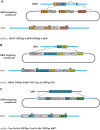
Figure 1—figure supplement 1.. Engineering of ubi2-4 to express K-to-R mutant ubiquitin.
(A) UBI2 was modified to express two copies of the ribosomal protein Rpl40A, each from a GPD promoter. The locus is marked with a hygromycin resistance cassette. (B) The engineered UBI3 locus is marked with a URA3 cassette and expresses three tandem copies of ubiquitin fused to the ribosomal protein Rps31, under the control of the GPD promoter. An additional copy of Rps31 is expressed from its own GPD promoter. (C) UBI4 was modified to carry two copies of the GPD promoter, each driving expression of mutant ubiquitin. The locus is marked with a nourseothricin (NAT) resistance cassette. (A–C) Asterisks indicate mutant ubiquitin alleles.
Figure 1—figure supplement 2.
Figure 1—figure supplement 2.. Analysis of ubiquitin levels in K-to-R ubiquitin mutants.
The levels of ubiquitin were analyzed by western blotting. A wild-type SK1 strain with endogenous UBI1-4 was compared to the strains used in this study that express K-to-R mutant ubiquitin alleles, as well as wild-type ubiquitin, from engineered ubiquitin loci. PSTAIR was used as loading control.
Figure 1—figure supplement 3.
Figure 1—figure supplement 3.. Engineering of strains expressing low levels of ubiquitin, and K48R ubiquitin mutants.
(A) A strain expressing ubiquitin at low levels was generated as described in Figure 1—figure supplement 1, with the notable difference that UBI4 locus was replaced only with the NAT resistance cassette. Ubiquitin is therefore only expressed from ubi3. (B) Strains expressing K48R ubiquitin were complemented with wild-type ubiquitin to permit viability. At ubi3, the first two ubiquitins are mutated at K48, while the third ubiquitin is wild type; at ubi4, K48R mutant ubiquitin is expressed. Asterisks indicate mutant ubiquitin alleles. Strains expressing ubiquitin with the K48R and another lysine mutation express one copy of double lysine mutant ubiquitin at ubi3 and two copies at ubi4.
Figure 1—figure supplement 4.
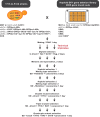
Figure 1—figure supplement 4.. The ubiquitin allele SGA protocol Ubiquitin K-to-R mutant strains were mated to an array of single-gene deletion strains.
Several selection steps allowed for the generation of haploid, MATa strains carrying a single gene deletion and expressing K-to-R mutant ubiquitin. The colony sizes of each strain were recorded to identify genetic interactions. A detailed description of the ubiquitin allele protocol is included in the Materials and methods section.
Figure 1—figure supplement 5.
Figure 1—figure supplement 5.. Genetic modifications modestly increase the sporulation efficiency of the S288C yeast strain.
The sporulation efficiency of S288C diploid cells was recorded after 4 days in sporulation media at 23°C. Modest increases in sporulation efficiency were observed in cells lacking RME1, or carrying one or two extra copies of IME1, IME2, or NDT80, as indicated.
Figure 1—figure supplement 6.
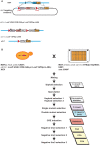
Figure 1—figure supplement 6.. Deletion of UBI1 in K-to-R ubiquitin mutant strains and the in the SK1 gene deletion array.
(A) UBI1 was replaced with a construct expressing the ribosomal protein Rpl40a driven by the GPD1 promoter. The final ubi1 locus does not carry a marker. Initially, UBI1 was replaced with a URA3-marked construct expressing the Cre recombinase protein from a galactose-inducible promoter, and flanked by LoxP recombination sites. After crossing this construct into the deletion collection, Cre was induced with galactose and the URA3 marker and Gal1pr-Cre construct were excised from the genome by the Cre recombinase. This excision was extremely robust and was selected for in the UBI1 backcrossed library with 5FOA (B) The steps undertaken to modify UBI1 in the entire SK1 gene deletion array are detailed.
Figure 2.
Figure 2.. Gene deletions exhibit genetic interactions with specific ubiquitin linkage types.
(A–C) Left: The genetic interaction scores of K-to-R ubiquitin mutants with deletions of UBC4 (A), HOM2 (B), or CDC26 (C); Scores less than zero represent varying degrees of negative genetic interactions (blue bars), while scores larger than zero indicate positive interactions (yellow bars). Right: Candidate genetic interactions were validated by 5-fold spot dilution assays of the indicated strains.
Figure 3.
Figure 3.. K11 linkages are functionally redundant with threonine biosynthesis and promote threonine import.
(A) Gene Ontology (GO) term enrichment analysis was performed on the genetic interactions of the K11R ubiquitin mutant having genetic interaction scores of −2 or less. The fold enrichment of biological function GO terms (BP_Direct) that were significantly enriched is shown. (B) The genetic interaction scores of the K11R ubiquitin mutant were plotted against the averaged genetic interaction scores of all K-to-R strains not containing the K11R mutation. Highlighted genes had negative interactions specifically with the K11R ubiquitin mutant, and had related functions in amino acid biosynthesis. (C) HOM2 and HOM3 are required for the biosynthesis of homoserine, a methionine and threonine precursor. (D) The negative genetic interactions of the K11R ubiquitin mutant with deletions of HOM2 or HOM3 were validated by fivefold spot dilution assays of the indicated strains. Excess homoserine, threonine, or methionine was added to C-leu plates as noted. (E) The correlation coefficient between the genetic interactions of the K11R ubiquitin mutant and single gene deletion strains was calculated. The genetic interactome of the K11R ubiquitin mutant is most similar to the genetic interactions of strains carrying deletions of GNP1 or YDR509W. (F) The import of tritiated threonine into wild-type and K11R ubiquitin mutant cells was measured by scintillation counting. The Y-axis shows the measured counts per minute (CPM) divided by optical density (OD600) of the cell cultures (CPM/OD600). (G) A negative genetic interaction between deletions of HOM2 and DOA10 is shown by spot dilution assays of the indicated strains. The genetic interaction is abrogated by addition of homoserine to C-leu plates.
Figure 3—figure supplement 1.
Figure 3—figure supplement 1.. Gnp1 is a major threonine permease.
The import of tritiated threonine into wild-type cells and cells lacking Gnp1 was measured by scintillation counting. The Y-axis shows the measured counts per minute (CPM) divided by optical density (OD600) of the cell cultures (CPM/OD600).
Figure 4.
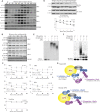
Figure 4.. K11 linkages contribute to APC-substrate turnover.
(A) Wild type and K11R ubiquitin mutant cells lacking Cdc26 were synchronized in G1 phase with α factor, then released into the cell cycle. Samples were taken at the specified times after release and analyzed by probing western blots for the indicated proteins. (B, C) cdc26Δ cells expressing wild type or K11R ubiquitin were arrested in G1 with α-factor. Cells were washed in fresh media to release from the arrest and, after sixty minutes, protein synthesis was blocked by the addition of cycloheximide. The APC was active at this time point, as measured by Pds1 and Clb5 turnover (Panel 4A). Samples were taken at the specified times after cycloheximide addition and analyzed by probing western blots for the indicated proteins. Bands were quantified using the Licor Image Studio Software and were normalized to Cdc28 or PSTAIR as loading controls (n = 3). A second order polynomial best-fit line was calculated. Half lives were calculated by determining the slope of the line tangent to the best fit curve at T = 0. (D) Cells were synchronized in G1 phase with α factor. During the G1 arrest, Clb2-6xHis-3xFlag expression was induced by the addition of galactose, and cells were shifted to 37°C. Clb2 synthesis was then blocked by removal of galactose, and addition of glucose and cycloheximide. The levels of Clb2-6xHis-3xFlag in wild-type and K11R ubiquitin cells lacking Cdc26 were analyzed by western blotting at the indicated times. Cdc28 was examined as a loading control using Anti-PSTAIR antibody. Bands were quantified as in Figure 4C. (E) A radioactively labeled fragment of Hsl1, amino acids 667–872, was incubated with or without APC/Cdh1, Ubc4, and different forms of ubiquitin, as indicated. The ubiquitination of Hsl1 was analyzed by SDS-PAGE and autoradiography. (F) All lysine residues on Hsl1 (667-872) were mutated to arginine, except for two lysines (K775, 812) that are part of 2 KEN box degrons, and lysine 747, which has been previously reported as being ubiquitinated. This Hsl1 fragment is termed Hsl1-3K, and was analyzed as in 4E. (G) A model describing the well-established role of K11 linkages in mammalian cells, and their function in yeast APC substrate degradation as suggested by the data presented here.
Figure 4—figure supplement 1.
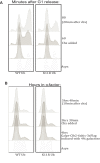
Figure 4—figure supplement 1.. Cell cycle profiling by FACS.
(A) WT and K11R mutant cells were treated as in Figure 4B and analyzed by flow cytometry. (B) WT and K11R mutant cells were treated as in Figure 4D and analyzed by flow cytometry. Importantly, the high flocculence of the SK1 strain renders interpretation of cell cycle profiles by FACS difficult (Cox and Mann, 2008).

Similar articles

Cited by

References

    1. Akutsu M, Dikic I, Bremm A. Ubiquitin chain diversity at a glance. Journal of Cell Science. 2016;129:875–880. doi: 10.1242/jcs.183954. - DOI - PubMed
    1. Arlt H, Perz A, Ungermann C. An overexpression screen in Saccharomyces cerevisiae identifies novel genes that affect endocytic protein trafficking. Traffic. 2011;12:1592–1603. doi: 10.1111/j.1600-0854.2011.01252.x. - DOI - PubMed
    1. Arnason T, Ellison MJ. Stress resistance in Saccharomyces cerevisiae is strongly correlated with assembly of a novel type of multiubiquitin chain. Molecular and Cellular Biology. 1994;14:7876–7883. doi: 10.1128/MCB.14.12.7876. - DOI - PMC - PubMed
    1. Ben-Ari G, Zenvirth D, Sherman A, David L, Klutstein M, Lavi U, Hillel J, Simchen G. Four linked genes participate in controlling sporulation efficiency in budding yeast. PLOS Genetics. 2006;2:e195. doi: 10.1371/journal.pgen.0020195. - DOI - PMC - PubMed
    1. Birsa N, Norkett R, Wauer T, Mevissen TE, Wu HC, Foltynie T, Bhatia K, Hirst WD, Komander D, Plun-Favreau H, Kittler JT. Lysine 27 ubiquitination of the mitochondrial transport protein Miro is dependent on serine 65 of the Parkin ubiquitin ligase. Journal of Biological Chemistry. 2014;289:14569–14582. doi: 10.1074/jbc.M114.563031. - DOI - PMC - PubMed

Publication types

MeSH terms