. 2018 Dec 5;8(1):17679.
doi: 10.1038/s41598-018-35877-4.

High Abundance of genus Prevotella in the gut of perinatally HIV-infected children is associated with IP-10 levels despite therapy

Affiliations

High Abundance of genus Prevotella in the gut of perinatally HIV-infected children is associated with IP-10 levels despite therapy

Urvinder S Kaur et al. Sci Rep. .

Abstract

Perinatal HIV infection is characterized by faster HIV disease progression and higher initial rate of HIV replication compared to adults. While antiretroviral therapy (ART) has greatly reduced HIV replication to undetectable levels, there is persistent elevated inflammation associated with HIV disease progression. Alteration of gut microbiota is associated with increased inflammation in chronic adult HIV infection. Here, we aim to study the gut microbiome and its role in inflammation in treated and untreated HIV-infected children. Examination of fecal microbiota revealed that perinatally infected children living with HIV had significantly higher levels of genus Prevotella that persisted despite ART. These children also had higher levels of soluble CD14 (sCD14), a marker of microbial translocation, and IP-10 despite therapy. The Prevotella positively correlated with IP-10 levels in both treated and untreated HIV-infected children, while genus Prevotella and species Prevotella copri was inversely associated with CD4 count. Relative abundance of genus Prevotella and species Prevotella copri showed positive correlation with sCD14 in ART-suppressed perinatally HIV-infected children. Our study suggests that gut microbiota may serve as one of the driving forces behind the persistent inflammation in children despite ART. Reshaping of microbiota using probiotics may be recommended as an adjunctive therapy along with ART.


Conflict of interest statement

The authors declare no competing interests.

Figures
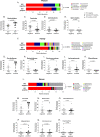
Figure 1
Figure 1
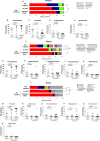
(A) Stacked bar plot depicting mean relative abundance of top nine abundant phyla in the fecal samples of HIV negative and HIV positive children. Dot Plots representing relative abundance of phyla (B) Bacteroidetes (C) Firmicutes, (D) Actinobacteria, and (E) Spirochaetes in HIV negative and HIV positive children. (F) Stacked bar plot showing mean relative abundance of top twelve abundant families in the fecal samples of HIV negative and HIV positive children. Dot Plots representing relative abundance of families (G) Prevotellaceae, (H) Bacteroidaceae (I) Ruminococcaceae (J) Lachnospiraceae and (K) Rikenellaceae in HIV negative and HIV positive children. (L) Stacked bar plot showing mean relative abundance of top twelve abundant genera in the fecal samples of HIV negative and HIV positive children. Dot Plots representing relative abundance of genera (M) Prevotella (N) Bacteroides (O) Faecalibacterium (P) Megasphaera (Q) Ruminococcus and (R) Haemophilus in HIV negative and HIV positive children. The horizontal line and deviation in the dot plot represents median and interquartile range (IQR), respectively. Mann-Whitney-U-test was performed for statistical analysis. p < 0.05 was considered to be significant. Significant differences in the overall relative abundance of fecal microbiota at phylum, family and genus level between HIV negative and HIV positive children were estimated using adonis function of vegan R package.
Figure 2
Figure 2
(A) Stacked bar plot depicting mean relative abundance of top nine abundant phyla n the fecal samples of HIV negative, on ART and treatment naïve perinatally HIV-infected children. Comparison of relative abundance of phyla (B) Bacteroidetes (C) Firmicutes, (D) Actinobacteria and (E) Spirochaetes across HIV negative, on ART and treatment naïve perinatally HIV-infected children. (F) Stacked bar plot showing mean relative abundance of top twelve abundant families in the fecal samples of HIV negative, on ART and treatment naïve perinatally HIV-infected children. Comparison of relative abundance of families (G) Prevotellaceae, (H) Bacteroidaceae (I) Ruminococcaceae (J) Lachnospiraceae and (K) Rikenellaceae across HIV negative, on ART and treatment naïve perinatally HIV-infected children. (L) Stacked bar plot showing mean relative abundance of top twelve abundant genera in the fecal samples of HIV negative, on ART and treatment naïve perinatally HIV-infected children. Comparison of relative abundance of genera (M) Prevotella (N) Bacteroides (O) Faecalibacterium (P) Megasphaera (Q) Ruminococcus and (R) Haemophilus across HIV negative, on ART and treatment naïve perinatally HIV-infected children. The horizontal line and deviation in the dot plot represents median and interquartile range (IQR), respectively. Kruskal-Wallis one-way ANOVA with Dunn’s multiple comparison was performed for statistical analysis. p < 0.05 was considered to be significant. Significant differences in the overall relative abundance of fecal microbiota at phylum, family and genus level between HIV negative controls, On ART and treatment naïve HIV-infected children were estimated using adonis function of vegan R package. *p < 0.05, **p < 0.005, p < 0.0005.
Figure 3
Figure 3
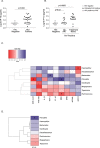
(A) LEfSe analysis showing the bacterial taxa that were significantly different in abundance between HIV positive children and HIV negative controls. Taxa enriched in HIV positive children are shown in green with positive LDA score and HIV negative controls in red with negative LDA score. Taxa passing LDA threshold value of >2.4 are only shown. (B) Cladogram representing the differentially abundant taxa between HIV positive children and HIV negative controls. Bacterial taxa enriched in HIV positive children and HIV negative controls are shown in green and red respectively. Brightness of each dot is proportional to taxon abundance. (C) LEfSe identifies significantly differentially abundant taxa between treatment naïve and On ART HIV-infected children and HIV. Taxa enriched in treatment naive HIV-infected children are shown in green with positive LDA score and On ART HIV-infected children in red with negative LDA score. Taxa passing LDA threshold value of >2.4 are only shown. (D) Taxonomic Cladogram. Red and green shows bacterial taxa enriched in On ART and treatment naïve HIV-infected children and uninfected controls, respectively. Brightness of each dot is proportional to taxon abundance.
Figure 4
Figure 4
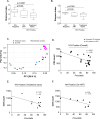
(A) Shannon and (B) Simpson indices were used to estimate the α-diversity of fecal microbiome of HIV negative controls, ART-suppressed and treatment naïve perinatally HIV infected children. (C) Plot of principle component analysis of fecal microbiome of HIV negative controls (green), On ART (pink) and treatment naïve (blue) perinatally HIV infected subjects. Association between relative abundance of Prevotella and CD4 count in (D) HIV positive children (overall), (E) treatment naïve and (F) On ART perinatally HIV infected children. Statistical analysis was carried out using the Spearman t-test. A linear regression line is included in each plot. p < 0.05 was considered to be significant.
Figure 5
Figure 5
Dot plots representing relative abundance of Prevotella copri in the fecal sample of (A) HIV positive and HIV negative children and (B) HIV negative, On ART and treatment naïve perinatally HIV-infected children. The horizontal line and deviation in the dot plot represents median and interquartile range (IQR), respectively. Mann-Whitney U-test and Kruskal-Wallis one-way ANOVA with Dunn’s multiple comparison were performed for statistical analysis. The p < 0.05 was considered to be significant. Correlation between relative abundance of Prevotella copri and CD4 count in (C) HIV positive children (overall), (D) treatment naïve. (E) On ART perinatally HIV infected children. Statistical analysis was carried out using Spearman t-test. A linear regression line is included in each plot. p < 0.05 was considered to be significant.
Figure 6
Figure 6
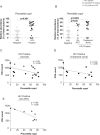
Comparison of Plasma IP-10 levels in (A) HIV positive and HIV negative children and (B) HIV negative, on ART and treatment naïve perinatally HIV-infected children. The horizontal line and deviation in the dot plot represents median and interquartile range (IQR), respectively. Mann-Whitney U-test and Kruskal-Wallis one-way ANOVA with Dunn’s multiple comparison were performed for statistical analysis. p < 0.05 was considered to be significant. (C) Heatmap representing the associations of relative abundance of significantly distinct genera with CD4 count, viral load, IL-1β, TNF-α, IP-10, GRO, MCD, sCDl40L and microbial translocation marker, sCD14. Blue and red shading represents positive and negative association respectively. Clustering was carried out based on the association of genera with clinical and immune parameters. (D) Heatmap representing the associations of absolute abundance of significantly distinct genera with IP-10. Blue shading indicates positive association and red shading indicates negative association. Clustering was carried out based on the association of genera with IP-10. Statistical analysis was carried out using Spearman t-test. p < 0.05 was considered to be significant. *p < 0.05.
Figure 7
Figure 7
Association between absolute abundance of Prevotella and plasma IP-10 level (pg/ml) in (A) HIV positive children, (B) on ART and (C) treatment naïve perinatally HIV infected children. Statistical analysis was performed using Spearman t-test. A linear regression line is included in each plot. p < 0.05 was considered to be significant. Comparison of Plasma sCD14 levels in (D) HIV positive and HIV negative children and (E) HIV negative, on ART and treatment naïve perinatally HIV-infected children. The horizontal line and deviation in the dot plot represents median and interquartile range (IQR), respectively. Mann-Whitney U-test and Kruskal-Wallis one-way ANOVA with Dunn’s multiple comparison were performed for statistical analysis. p < 0.05 was considered to be significant. Association between (F) relative abundance of Prevotella and plasma sCD14 level (ng/ml) (G) relative abundance of Prevotella copri and plasma sCD14 level (ng/ml) in ART-suppressed perinatally HIV infected children. Statistical analysis was performed using Spearman t-test. A linear regression line is included in each plot. The p < 0.05 was considered to be significant.

Similar articles

Cited by

References

    1. Pasternak AO, et al. Cellular levels of HIV unspliced RNA from patients on combination antiretroviral therapy with undetectable plasma viremia predict the therapy outcome. PLoS One. 2009;4:e8490. doi: 10.1371/journal.pone.0008490. - DOI - PMC - PubMed
    1. Marin B, et al. Non-AIDS-defining deaths and immunodeficiency in the era of combination antiretroviral therapy. AIDS. 2009;23:1743–1753. doi: 10.1097/QAD.0b013e32832e9b78. - DOI - PMC - PubMed
    1. Guaraldi G, et al. Premature age-related comorbidities among HIV-infected persons compared with the general population. Clin Infect Dis. 2011;53:1120–1126. doi: 10.1093/cid/cir627. - DOI - PubMed
    1. Brenchley JM, et al. Differential Th17 CD4 T-cell depletion in pathogenic and nonpathogenic lentiviral infections. Blood. 2008;112:2826–2835. doi: 10.1182/blood-2008-05-159301. - DOI - PMC - PubMed
    1. Favre D, et al. Tryptophan catabolism by indoleamine 2,3-dioxygenase 1 alters the balance of TH17 to regulatory T cells in HIV disease. Sci Transl Med. 2010;2:32ra36. doi: 10.1126/scitranslmed.3000632. - DOI - PMC - PubMed

Publication types