Persistent reduction in sialylation of cerebral glycoproteins following postnatal inflammatory exposure
- PMID: 30518374
- PMCID: PMC6282350
- DOI: 10.1186/s12974-018-1367-2
Persistent reduction in sialylation of cerebral glycoproteins following postnatal inflammatory exposure
Abstract
Background: The extension of sepsis encompassing the preterm newborn's brain is often overlooked due to technical challenges in this highly vulnerable population, yet it leads to substantial long-term neurodevelopmental disabilities. In this study, we demonstrate how neonatal neuroinflammation following postnatal E. coli lipopolysaccharide (LPS) exposure in rat pups results in persistent reduction in sialylation of cerebral glycoproteins.
Methods: Male Sprague-Dawley rat pups at postnatal day 3 (P3) were injected in the corpus callosum with saline or LPS. Twenty-four hours (P4) or 21 days (P24) following injection, brains were extracted and analyzed for neuraminidase activity and expression as well as for sialylation of cerebral glycoproteins and glycolipids.
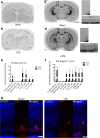
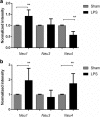
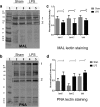
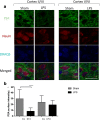
Results: At both P4 and P24, we detected a significant increase of the acidic neuraminidase activity in LPS-exposed rats. It correlated with significantly increased neuraminidase 1 (Neu1) mRNA in LPS-treated brains at P4 and with neuraminidases 1 and 4 at P24 suggesting that these enzymes were responsible for the rise of neuraminidase activity. At both P4 and P24, sialylation of N-glycans on brain glycoproteins decreased according to both mass-spectrometry analysis and lectin blotting, but the ganglioside composition remained intact. Finally, at P24, analysis of brain tissues by immunohistochemistry showed that neurons in the upper layers (II-III) of somatosensory cortex had a reduced surface content of polysialic acid.
Conclusions: Together, our data demonstrate that neonatal LPS exposure results in specific and sustained induction of Neu1 and Neu4, causing long-lasting negative changes in sialylation of glycoproteins on brain cells. Considering the important roles played by sialoglycoproteins in CNS function, we speculate that observed re-programming of the brain sialome constitutes an important part of pathophysiological consequences in perinatal infectious exposure.
Keywords: Lysosomal dysfunction; Neonatal neuroinflammation; Neonatal rat model; Neuronal neuraminidase 1; Sialic acid.
Conflict of interest statement
Authors’ information
Not applicable.
Ethics approval
Approval for the animal experimentation was granted by the Animal Care and Use Committee of the Montreal Heart Institute and by the Animal Care and Use Committee of the CHU Sainte-Justine.
Consent for publication
All authors approved the final manuscript as submitted and agree to be accountable for all aspects of the work. All authors gave their consent for this publication.
Competing interests
The authors declare that they have no competing interests.
Publisher’s Note
Springer Nature remains neutral with regard to jurisdictional claims in published maps and institutional affiliations.
Figures


Similar articles
-
[Glycoprotein sialylation and NEU1 and ST6GAL1 expressions in erythremia].Fiziol Zh (1994). 2014;60(5):14-22. Fiziol Zh (1994). 2014. PMID: 25566667 Ukrainian.
-
The induction of neuronal death by up-regulated microglial cathepsin H in LPS-induced neuroinflammation.J Neuroinflammation. 2015 Mar 19;12:54. doi: 10.1186/s12974-015-0268-x. J Neuroinflammation. 2015. PMID: 25889123 Free PMC article.
-
Erythropoietin attenuates lipopolysaccharide-induced white matter injury in the neonatal rat brain.Neonatology. 2007;92(4):269-78. doi: 10.1159/000105493. Epub 2007 Jul 11. Neonatology. 2007. PMID: 17627093
-
Keeping it trim: roles of neuraminidases in CNS function.Glycoconj J. 2018 Aug;35(4):375-386. doi: 10.1007/s10719-018-9837-4. Epub 2018 Aug 7. Glycoconj J. 2018. PMID: 30088207 Free PMC article. Review.
-
Desialylation of surface receptors as a new dimension in cell signaling.Biochemistry (Mosc). 2013 Jul;78(7):736-45. doi: 10.1134/S0006297913070067. Biochemistry (Mosc). 2013. PMID: 24010837 Review.
Cited by
-
Risk factors and postnatal biomarkers for acute placental inflammatory lesions and intrauterine infections in preterm infants.Eur J Pediatr. 2022 Sep;181(9):3429-3438. doi: 10.1007/s00431-022-04545-1. Epub 2022 Jul 14. Eur J Pediatr. 2022. PMID: 35831682 Free PMC article.
-
Control of Innate Immunity by Sialic Acids in the Nervous Tissue.Int J Mol Sci. 2020 Jul 31;21(15):5494. doi: 10.3390/ijms21155494. Int J Mol Sci. 2020. PMID: 32752058 Free PMC article. Review.
-
Combined Effect of Maternal Separation and Early-Life Immune Activation on Brain and Behaviour of Rat Offspring.Biomolecules. 2024 Feb 7;14(2):197. doi: 10.3390/biom14020197. Biomolecules. 2024. PMID: 38397434 Free PMC article.
-
Post-translational modifications glycosylation and phosphorylation of the major hepatic plasma protein fetuin-A are associated with CNS inflammation in children.PLoS One. 2022 Oct 7;17(10):e0268592. doi: 10.1371/journal.pone.0268592. eCollection 2022. PLoS One. 2022. PMID: 36206263 Free PMC article.
-
Microglia Mediate Contact-Independent Neuronal Network Remodeling via Secreted Neuraminidase-3 Associated with Extracellular Vesicles.ACS Cent Sci. 2023 Oct 31;9(11):2108-2114. doi: 10.1021/acscentsci.3c01066. eCollection 2023 Nov 22. ACS Cent Sci. 2023. PMID: 38033791 Free PMC article.
References
-
- Hakomori S. Carbohydrate-to-carbohydrate interaction, through glycosynapse, as a basis of cell recognition and membrane organization. Glycoconj J. 2004;21:125–137. doi: 10.1023/B:GLYC.0000044844.95878.cf. - DOI - PubMed
MeSH terms
Substances
Grants and funding
LinkOut - more resources
Full Text Sources
Medical

