High-performance reconstruction of microscopic force fields from Brownian trajectories
- PMID: 30514840
- PMCID: PMC6279749
- DOI: 10.1038/s41467-018-07437-x
High-performance reconstruction of microscopic force fields from Brownian trajectories
Abstract
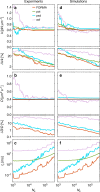
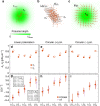
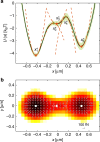
The accurate measurement of microscopic force fields is crucial in many branches of science and technology, from biophotonics and mechanobiology to microscopy and optomechanics. These forces are often probed by analysing their influence on the motion of Brownian particles. Here we introduce a powerful algorithm for microscopic force reconstruction via maximum-likelihood-estimator analysis (FORMA) to retrieve the force field acting on a Brownian particle from the analysis of its displacements. FORMA estimates accurately the conservative and non-conservative components of the force field with important advantages over established techniques, being parameter-free, requiring ten-fold less data and executing orders-of-magnitude faster. We demonstrate FORMA performance using optical tweezers, showing how, outperforming other available techniques, it can identify and characterise stable and unstable equilibrium points in generic force fields. Thanks to its high performance, FORMA can accelerate the development of microscopic and nanoscopic force transducers for physics, biology and engineering.
Conflict of interest statement
The authors declare no competing interests.
Figures


Similar articles
-
Enhanced Signal-to-Noise and Fast Calibration of Optical Tweezers Using Single Trapping Events.Micromachines (Basel). 2021 May 17;12(5):570. doi: 10.3390/mi12050570. Micromachines (Basel). 2021. PMID: 34067843 Free PMC article.
-
Optimal calibration of optical tweezers with arbitrary integration time and sampling frequencies: a general framework [Invited].Biomed Opt Express. 2023 Nov 28;14(12):6442-6469. doi: 10.1364/BOE.495468. eCollection 2023 Dec 1. Biomed Opt Express. 2023. PMID: 38420310 Free PMC article.
-
Macromolecular crowding: chemistry and physics meet biology (Ascona, Switzerland, 10-14 June 2012).Phys Biol. 2013 Aug;10(4):040301. doi: 10.1088/1478-3975/10/4/040301. Epub 2013 Aug 2. Phys Biol. 2013. PMID: 23912807
-
Shining Light in Mechanobiology: Optical Tweezers, Scissors, and Beyond.ACS Photonics. 2024 Mar 11;11(3):917-940. doi: 10.1021/acsphotonics.4c00064. eCollection 2024 Mar 20. ACS Photonics. 2024. PMID: 38523746 Free PMC article. Review.
-
Optothermal Manipulations of Colloidal Particles and Living Cells.Acc Chem Res. 2018 Jun 19;51(6):1465-1474. doi: 10.1021/acs.accounts.8b00102. Epub 2018 May 25. Acc Chem Res. 2018. PMID: 29799720 Free PMC article. Review.
Cited by
-
Using the transient trajectories of an optically levitated nanoparticle to characterize a stochastic Duffing oscillator.Sci Rep. 2020 Sep 2;10(1):14436. doi: 10.1038/s41598-020-70908-z. Sci Rep. 2020. PMID: 32879371 Free PMC article.
-
Photon-efficient optical tweezers via wavefront shaping.Sci Adv. 2024 Jul 5;10(27):eadi7792. doi: 10.1126/sciadv.adi7792. Epub 2024 Jul 5. Sci Adv. 2024. PMID: 38968347 Free PMC article.
-
Inferring potential landscapes from noisy trajectories of particles within an optical feedback trap.iScience. 2022 Jul 19;25(9):104731. doi: 10.1016/j.isci.2022.104731. eCollection 2022 Sep 16. iScience. 2022. PMID: 36034218 Free PMC article.
-
Non-equilibrium properties of an active nanoparticle in a harmonic potential.Nat Commun. 2021 Mar 26;12(1):1902. doi: 10.1038/s41467-021-22187-z. Nat Commun. 2021. PMID: 33772007 Free PMC article.
-
Sparse inference and active learning of stochastic differential equations from data.Sci Rep. 2022 Dec 15;12(1):21691. doi: 10.1038/s41598-022-25638-9. Sci Rep. 2022. PMID: 36522347 Free PMC article.
References
-
- Aspelmeyer M, Kippenberg TJ, Marquardt F. Cavity optomechanics. Rev. Mod. Phys. 2014;86:1391–1452. doi: 10.1103/RevModPhys.86.1391. - DOI
-
- Jones PH, Maragò OM, Volpe G. Optical tweezers: Principles and applications. Cambridge: Cambridge University Press; 2015.
-
- Florin EL, Pralle A, Stelzer EHK, Hörber JKH. Photonic force microscope calibration by thermal noise analysis. Appl. Phys. A. 1998;66:S75–S78. doi: 10.1007/s003390051103. - DOI
Publication types
Grants and funding
LinkOut - more resources
Full Text Sources

