. 2019 Feb 1;294(5):1451-1463.
doi: 10.1074/jbc.RA118.006620. Epub 2018 Dec 4.

Nuclear condensates of the Polycomb protein chromobox 2 (CBX2) assemble through phase separation

Affiliations

Nuclear condensates of the Polycomb protein chromobox 2 (CBX2) assemble through phase separation

Roubina Tatavosian et al. J Biol Chem. .

Abstract

Polycomb group (PcG) proteins repress master regulators of development and differentiation through organization of chromatin structure. Mutation and dysregulation of PcG genes cause developmental defects and cancer. PcG proteins form condensates in the cell nucleus, and these condensates are the physical sites of PcG-targeted gene silencing via formation of facultative heterochromatin. However, the physiochemical principles underlying the formation of PcG condensates remain unknown, and their determination could shed light on how these condensates compact chromatin. Using fluorescence live-cell imaging, we observed that the Polycomb repressive complex 1 (PRC1) protein chromobox 2 (CBX2), a member of the CBX protein family, undergoes phase separation to form condensates and that the CBX2 condensates exhibit liquid-like properties. Using site-directed mutagenesis, we demonstrated that the conserved residues of CBX2 within the intrinsically disordered region (IDR), which is the region for compaction of chromatin in vitro, promote the condensate formation both in vitro and in vivo We showed that the CBX2 condensates concentrate DNA and nucleosomes. Using genetic engineering, we report that trimethylation of Lys-27 at histone H3 (H3K27me3), a marker of heterochromatin formation produced by PRC2, had minimal effects on the CBX2 condensate formation. We further demonstrated that the CBX2 condensate formation does not require CBX2-PRC1 subunits; however, the condensate formation of CBX2-PRC1 subunits depends on CBX2, suggesting a mechanism underlying the assembly of CBX2-PRC1 condensates. In summary, our results reveal that PcG condensates assemble through liquid-liquid phase separation (LLPS) and suggest that phase-separated condensates can organize PcG-bound chromatin.

Keywords: CBX2; PRC1; PcG; Polycomb; chromatin; chromatin modification; chromatin regulation; chromatin structure; epigenetics; gene regulation; heterochromatin; histone; histone methylation; liquid-liquid phase separation; phase separation.


Conflict of interest statement

The authors declare that they have no conflicts of interest with the contents of this article

Figures
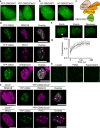
Figure 1.
Figure 1.
CBX2 phase separates to form condensates in cells. a, live-cell epifluorescence images of YFP-CBX2 in WT and Cbx2−/− mES cells. Scale bars, 5.0 μm. b, live-cell epifluorescence images of HT-CBX2 in WT and Cbx2−/− mES cells. HT-CBX2 was labeled with HaloTag TMR ligand. Scale bars, 5.0 μm. c, schematic representation of the core subunits of the CBX2–PRC1 complex. d, confocal fluorescence images of immunostained YFP-CBX2 and H3K27me3 in WT mES cells as well as endogenous RING1B and PHC1. We stained the cells using antibodies against YFP (green), RING1B (magenta), PHC1 (magenta), and H3K27me3 (magenta). Overlay images are shown. Scale bars, 10 μm. e, confocal fluorescence images of immunostained RING1B and PHC1 in Cbx2−/− mES cells as well as in YFP-CBX2/Cbx2−/− mES cells. We stained the cells using antibodies against YFP (green), RING1B (magenta), and PHC1 (magenta). Overlay images are shown. Scale bars, 10 μm. f, representative FRAP images of YFP-CBX2 stably expressed in WT mES cells. The images were taken before (Pre-b) and after (Post-b) photobleaching. The condensate that was bleached is indicated by a white arrowhead. Scale bar, 10 μm. g, FRAP curve of YFP-CBX2 in WT mES cells that stably express YFP-CBX2. The FRAP curve was obtained from averaging data from 10 cells. Error bars represent S.D. h, epifluorescence imaging of YFP-CBX2 condensates isolated from cells. We cross-linked cells stably expressing YFP-CBX2 with formaldehyde. Lysate was prepared. Both lysate and resuspended pellet contained YFP-CBX2 condensates; however, the supernatant did not have condensates. Scale bars, 2.0 μm.
Figure 2.
Figure 2.
CBX2 phase separates to form condensates in vitro. a, CBX2 is an intrinsically disordered protein predicted by MobiDB 3 (50). A PONDR score greater than 0.5 indicates intrinsically disordered regions. 59% of CBX2 sequence is intrinsically disordered. b, SDS-PAGE analysis of recombinant CBX2 proteins. Left, recombinant GST-CBX2-FLAG (GST-CBX2). Middle, recombinant CBX2-FLAG (CBX2). Right, recombinant GST-YFP-CBX2-FLAG (GST-YFP-CBX2). The molecular mass ladder is shown at the left of the gel image. c, representative DIC images of GST-CBX2 (4.8 μm) and CBX2 (4.8 μm) condensates as well as the control BSA (10 μm) and GST (10 μm) on the surface of a coverslip. A representative epifluorescence image of GST-YFP-CBX2 (4.8 μm) condensates is shown. Scale bars, 2.0 μm. d, dependence of the formation of CBX2 condensates on its concentrations shown above the images. Representative DIC images of condensates on the surface of coverslip are shown. Scale bars, 2.0 μm. e–g, increasing concentrations of NaCl, Triton X-100, and hexanediol dissolve CBX2 condensates. We incubated CBX2 (4.8 μm) condensates with the indicated concentrations of NaCl, Triton X-100, and hexanediol for 30 min on ice. The mixture was loaded to a coverslip for imaging. We counted condensates using ImageJ. The data were from at least 10 frames for each sample. Error bars represent S.D. p values were calculated based on Student's t test. h, representative epifluorescence images of WT mES cells stably expressing YFP-CBX2 before and after treatment with 10% hexanediol for 5.0 min. Scale bar, 10 μm.
Figure 3.
Figure 3.
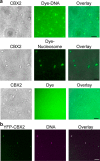
CBX2 condensates concentrate DNA and nucleosomes. a, micrographs of phase-separated CBX2 (4.8 μm) condensates with Alexa Fluor 488 (1.0 μm) or Alexa Fluor 488–labeled DNA (0.5 μm) as well as CBX2 (2.4 μm) condensates with Cy5-labeled nucleosomes (40 nm). DIC images of CBX2 condensates on the surface of coverslips are shown. Alexa Fluor 488, Alexa Fluor 488–labeled DNA, and Cy5-labeled nucleosomes are shown in fluorescence images. Overlay images are also shown. Scale bars, 2 μm. b, epifluorescence imaging of DNA and YFP-CBX2 condensates isolated from cells. We cross-linked mES cells stably expressing YFP-CBX2 with formaldehyde. Lysate was prepared. Resuspended pellets were stained with Hoechst. An overlay image is shown. Scale bar, 5.0 μm.
Figure 4.
Figure 4.
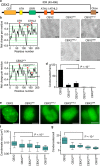
Conserved residues promote the LLPS of CBX2. a, schematic representation of CBX2. The IDR was predicted by MobiDB 3 (50). Conserved regions include CD, ATH, SRR, ATHL1, ATHL2, and chromobox (Cbox) (63). b, charge distribution of CBX2 and its variants calculated by EMBOSS charge. The net charge per residue was averaged over a sliding window of eight residues. The three covered regions, ATH, ATHL1, and ATHL2, are positively charged (top panel). The three conserved regions were mutated to generate CBX2ATH, CBX2ATHL1, and CBX2ATHL2 (bottom panel). The red asterisks indicate the three conserved regions that are mutated. c, representative DIC images of condensates of CBX2 and its variants (CBX2ATH, CBX2ATHL1, CBX2ATHL2, and CBX2SRR) on the surface of coverslips. The formation of condensates was carried out at a concentration of 4.8 μm for both CBX2 and its variants. d, quantification of condensates per frame from c. The data were from at least 10 frames for each sample. Error bars represent S.D. The p value was calculated based on Student's t test. e, representative epifluorescence images of WT mES cells stably expressing HT-CBX2 replicated from Fig. 1b and its variants (HT-CBX2ATH, HT-CBX2ATHL1, HT-CBX2ATHL2, and HT-CBX2SRR), respectively. We labeled HT-CBX2 and its variants by HaloTag TMR ligand and then performed live-cell epifluorescence imaging of cells with similar fluorescence intensity. Scale bars, 5.0 μm. f, box plot of the condensate sizes for HT-CBX2 and its variants (HT-CBX2ATH, HT-CBX2ATHL1, HT-CBX2ATHL2, and HT-CBX2SRR) from e. Data were obtained from at least 10 cells. Error bars represent upper and lower adjacent values. The p value was calculated based on Student's t test. g, box plot of the number of condensates for HT-CBX2 and its variants (HT-CBX2ATH, HT-CBX2ATHL1, HT-CBX2ATHL2, and HT-CBX2SRR) from e. Data were obtained from at least 10 cells. Error bars represent upper and lower adjacent values. The p value was calculated based on Student's t test.
Figure 5.
Figure 5.
H3K27me3 has minor effects on the CBX2 condensate formation. a, a hypothetic model for targeting CBX2 to chromatin. It has been proposed that CBX2 is recruited to chromatin through the interactions between CD and H3K27me3. b, schematic representation of CBX2 and its variants used in the study. CD is the binding domain for H3K27me3 in vitro. The residue Phe-12 is the key residue involved in the H3K27me3 binding in vitro. c, representative epifluorescence images for HT-CBX2 in WT mES cells replicated from Fig. 1b; for HT-CBX2 in Eed−/− mES cells; and for HT-CBX2F12A, HT-CDCBX2, HT-CBX2ΔCD, and HT-CBX2ΔCD-ATH in WT mES cells. We labeled HT-CBX2 fusions by HaloTag TMR ligand and performed live-cell epifluorescence imaging of cells with similar fluorescence intensity. Scale bars, 5.0 μm. d, box plot of the condensate sizes for HT-CBX2 in WT mES cells replicated from Fig. 4f; for HT-CBX2 in Eed−/− mES cells; and for HT-CBX2F12A, HT-CDCBX2, HT-CBX2ΔCD, and HT-CBX2ΔCD-ATH in WT mES cells. Data were obtained from at least 10 cells. Error bars represent upper and lower adjacent values. The p value was calculated based on Student's t test. e, box plot of the number of condensates for HT-CBX2 in WT mES cells replicated from Fig. 4g; for HT-CBX2 in Eed−/− mES cells; and for HT-CBX2F12A, HT-CDCBX2, HT-CBX2ΔCD, and HT-CBX2ΔCD-ATH in WT mES cells. Data were obtained from at least 10 cells. Error bars represent upper and lower adjacent values. The p value was calculated based on Student's t test.
Figure 6.
Figure 6.
Depletion of CBX2–PRC1 subunits does not prevent the formation of CBX2 condensates. a, representative epifluorescence images for HT-CBX2 in WT mES cells replicated from Fig. 1b, for HT-CBX2 in Ring1a−/−/Ring1b−/− mES cells, and for HT-CBX2 in Bmi1−/−/Mel18−/− mES cells. We labeled HT-CBX2 by HaloTag TMR ligand and performed live-cell epifluorescence imaging of cells with similar fluorescence intensity. Scale bars, 5.0 μm. b, box plot of the condensate sizes for HT-CBX2 in WT mES cells replicated from Fig. 4f, for HT-CBX2 in Ring1a−/−/Ring1b−/− mES cells, and for HT-CBX2 in Bmi1−/−/Mel18−/− mES cells. Data were obtained from at least 10 cells. Error bars represent upper and lower adjacent values. The p value was calculated based on Student's t test. c, box plot of the number of condensates for HT-CBX2 in WT mES cells replicated from Fig. 4g, for HT-CBX2 in Ring1a−/−/Ring1b−/− mES cells, and for HT-CBX2 in Bmi1−/−/Mel18−/− mES cells. Data were obtained from at least 10 cells. Error bars represent upper and lower adjacent values. The p value was calculated based on Student's t test.

Similar articles

Cited by

References

    1. Brown S. W. (1966) Heterochromatin. Science 151, 417–425 - PubMed
    1. Larson A. G., and Narlikar G. J. (2018) The role of phase separation in heterochromatin formation, function, and regulation. Biochemistry 57, 2540–2548 10.1021/acs.biochem.8b00401 - DOI - PMC - PubMed
    1. Trojer P., and Reinberg D. (2007) Facultative heterochromatin: is there a distinctive molecular signature? Mol. Cell 28, 1–13 10.1016/j.molcel.2007.09.011 - DOI - PubMed
    1. Reinberg D., and Vales L. D. (2018) Chromatin domains rich in inheritance. Science 361, 33–34 10.1126/science.aat7871 - DOI - PubMed
    1. Allshire R. C., and Madhani H. D. (2018) Ten principles of heterochromatin formation and function. Nat. Rev. Mol. Cell Biol. 19, 229–244 10.1038/nrm.2017.119 - DOI - PMC - PubMed

Publication types

MeSH terms

LinkOut - more resources