A biosensor-based approach reveals links between efflux pump expression and cell cycle regulation in pleiotropic drug resistance of yeast
- PMID: 30514758
- PMCID: PMC6349095
- DOI: 10.1074/jbc.RA118.003904
A biosensor-based approach reveals links between efflux pump expression and cell cycle regulation in pleiotropic drug resistance of yeast
Abstract
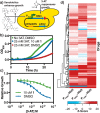
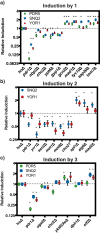
Multidrug resistance is highly conserved in mammalian, fungal, and bacterial cells, is characterized by resistance to several unrelated xenobiotics, and poses significant challenges to managing infections and many cancers. Eukaryotes use a highly conserved set of drug efflux transporters that confer pleiotropic drug resistance (PDR). To interrogate the regulation of this critical process, here we developed a small molecule-responsive biosensor that couples transcriptional induction of PDR genes to growth rate in the yeast Saccharomyces cerevisiae Using diverse PDR inducers and the homozygous diploid deletion collection, we applied this biosensor system to genome-wide screens for potential PDR regulators. In addition to recapitulating the activity of previously known factors, these screens identified a series of genes involved in a variety of cellular processes with significant but previously uncharacterized roles in the modulation of yeast PDR. Genes identified as down-regulators of the PDR included those encoding the MAD family of proteins involved in the mitotic spindle assembly checkpoint (SAC) complex. Of note, we demonstrated that genetic disruptions of the mitotic spindle assembly checkpoint elevate expression of PDR-mediating efflux pumps in response to exposure to a variety of compounds that themselves have no known influence on the cell cycle. These results not only establish our biosensor system as a viable tool for investigating PDR in a high-throughput fashion, but also uncover critical control mechanisms governing the PDR response and a previously uncharacterized link between PDR and cell cycle regulation in yeast.
Keywords: biosensor; drug resistance; gene regulation; microarray; multidrug transporter.
© 2019 Li et al.
Conflict of interest statement
U. S., C. J. B. H., and M. E. H. own shares in Hexagon Bio
Figures


Similar articles
-
Networks of genes modulating the pleiotropic drug response in Saccharomyces cerevisiae.Mol Biosyst. 2014 Jan;10(1):128-37. doi: 10.1039/c3mb70351g. Mol Biosyst. 2014. PMID: 24201294
-
The ATP-binding cassette multidrug transporter Snq2 of Saccharomyces cerevisiae: a novel target for the transcription factors Pdr1 and Pdr3.Mol Microbiol. 1996 Apr;20(1):109-17. doi: 10.1111/j.1365-2958.1996.tb02493.x. Mol Microbiol. 1996. PMID: 8861209
-
Activation of signaling pathways related to cell wall integrity and multidrug resistance by organic solvent in Saccharomyces cerevisiae.Curr Genet. 2014 Aug;60(3):149-62. doi: 10.1007/s00294-013-0419-5. Epub 2013 Dec 31. Curr Genet. 2014. PMID: 24378717
-
Yeast ATP-binding cassette transporters conferring multidrug resistance.Annu Rev Microbiol. 2012;66:39-63. doi: 10.1146/annurev-micro-092611-150111. Epub 2012 Jun 11. Annu Rev Microbiol. 2012. PMID: 22703054 Review.
-
Yeast multidrug resistance: the PDR network.J Bioenerg Biomembr. 1995 Feb;27(1):71-6. doi: 10.1007/BF02110333. J Bioenerg Biomembr. 1995. PMID: 7629054 Review.
Cited by
-
Elucidating Bile Acid Tolerance in Saccharomyces cerevisiae: Effects on Sterol Biosynthesis and Transport Protein Expression.Foods. 2024 Oct 25;13(21):3405. doi: 10.3390/foods13213405. Foods. 2024. PMID: 39517189 Free PMC article.
-
Integrative analysis of multi-omics data reveals inhibition of RB1 signaling promotes apatinib resistance of hepatocellular carcinoma.Int J Biol Sci. 2023 Aug 21;19(14):4511-4524. doi: 10.7150/ijbs.83862. eCollection 2023. Int J Biol Sci. 2023. PMID: 37781033 Free PMC article.
-
Biosensor-enabled pathway optimization in metabolic engineering.Curr Opin Biotechnol. 2022 Jun;75:102696. doi: 10.1016/j.copbio.2022.102696. Epub 2022 Feb 11. Curr Opin Biotechnol. 2022. PMID: 35158314 Free PMC article. Review.
References
Publication types
MeSH terms
Substances
Grants and funding
LinkOut - more resources
Full Text Sources
Molecular Biology Databases

