

Polysome profiling followed by RNA-seq of cardiac differentiation stages in hESCs
- PMID: 30512016
- PMCID: PMC6278691
- DOI: 10.1038/sdata.2018.287
Polysome profiling followed by RNA-seq of cardiac differentiation stages in hESCs
Abstract
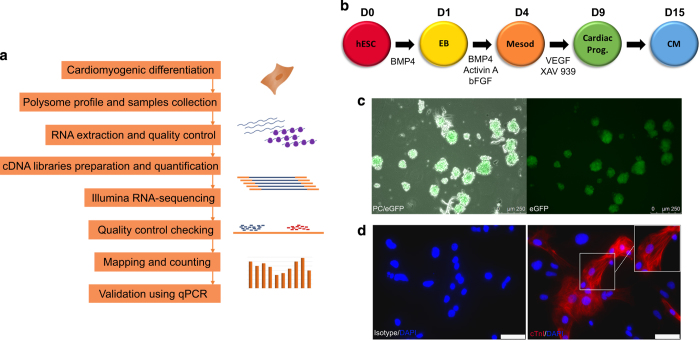
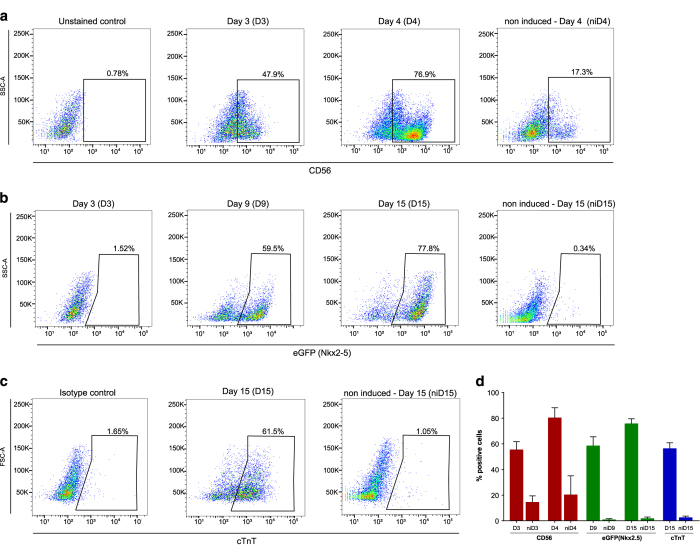
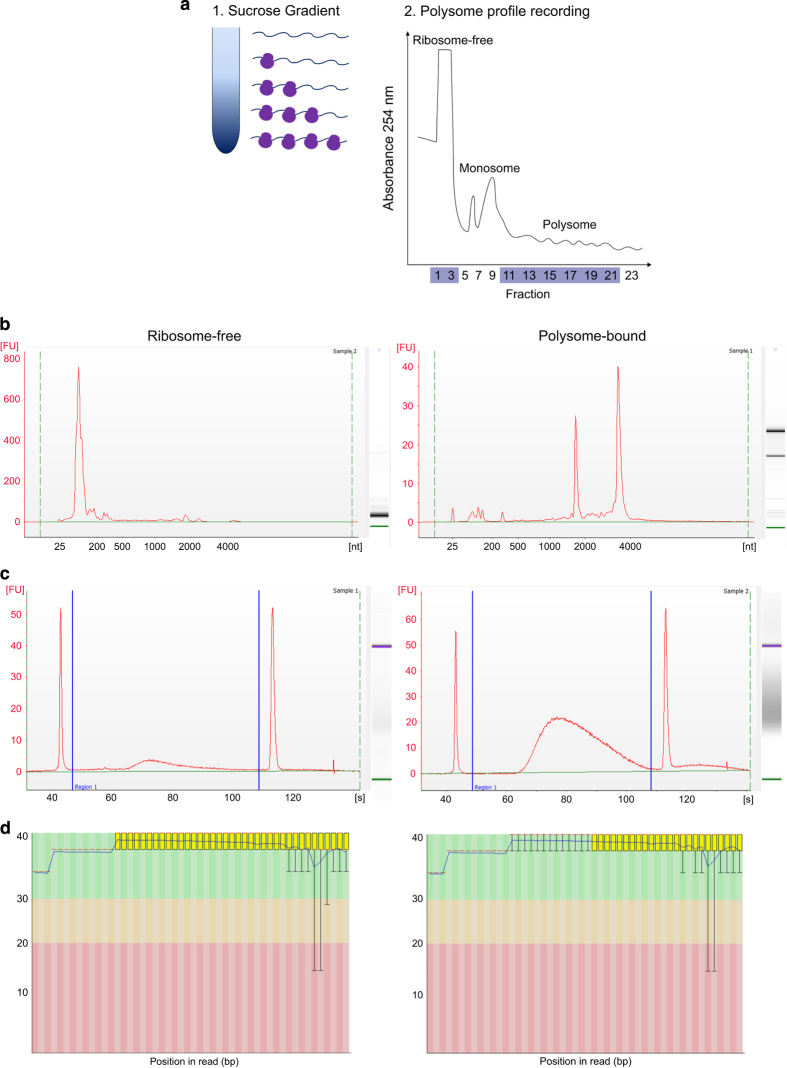
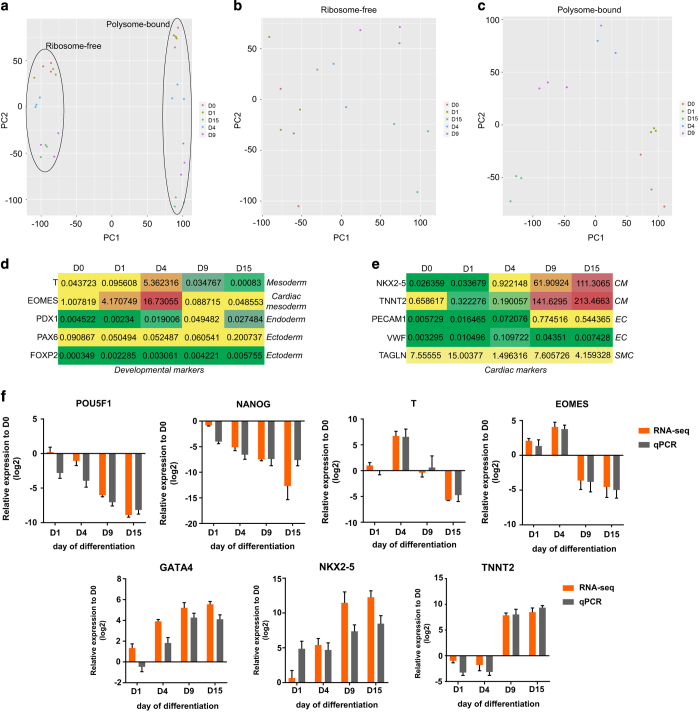
The regulation of gene expression acts at numerous complementary levels to control and refine protein abundance. The analysis of mRNAs associated with polysomes, called polysome profiling, has been used to investigate the post-transcriptional mechanisms that are involved in different biological processes. Pluripotent stem cells are able to differentiate into a variety of cell lineages, and the cell commitment progression is carefully orchestrated. Genome-wide expression profiling has provided the possibility to investigate transcriptional changes during cardiomyogenesis; however, a more accurate study regarding post-transcriptional regulation is required. In the present work, we isolated and high-throughput sequenced ribosome-free and polysome-bound RNAs from NKX2-5eGFP/w HES3 undifferentiated pluripotent stem cells at the subsequent differentiation stages of cardiomyogenesis: embryoid body aggregation, mesoderm, cardiac progenitor and cardiomyocyte. The expression of developmental markers was followed by flow cytometry, and quality analyses were performed as technical controls to ensure high quality data. Our dataset provides valuable information about hESC cardiac differentiation and can be used to investigate genes potentially controlled by post-transcriptional mechanisms.
Conflict of interest statement
The authors declare no competing interests.
Figures
Similar articles
-
Reorganization of Metabolism during Cardiomyogenesis Implies Time-Specific Signaling Pathway Regulation.Int J Mol Sci. 2021 Jan 29;22(3):1330. doi: 10.3390/ijms22031330. Int J Mol Sci. 2021. PMID: 33572750 Free PMC article.
-
Cardiomyogenic differentiation is fine-tuned by differential mRNA association with polysomes.BMC Genomics. 2019 Mar 15;20(1):219. doi: 10.1186/s12864-019-5550-3. BMC Genomics. 2019. PMID: 30876407 Free PMC article.
-
Genome-Wide Temporal Profiling of Transcriptome and Open Chromatin of Early Cardiomyocyte Differentiation Derived From hiPSCs and hESCs.Circ Res. 2017 Aug 4;121(4):376-391. doi: 10.1161/CIRCRESAHA.116.310456. Epub 2017 Jun 29. Circ Res. 2017. PMID: 28663367 Free PMC article.
-
Polysome-associated lncRNAs during cardiomyogenesis of hESCs.Mol Cell Biochem. 2020 May;468(1-2):35-45. doi: 10.1007/s11010-020-03709-7. Epub 2020 Mar 3. Mol Cell Biochem. 2020. PMID: 32125578
-
[Progress of the calcium signal pathway during cardiomyogenesis and cardiomyocyte differentiation].Yi Chuan. 2004 Mar;26(2):227-30. Yi Chuan. 2004. PMID: 15639992 Review. Chinese.
Cited by
-
Alternative polyadenylation and dynamic 3' UTR length is associated with polysome recruitment throughout the cardiomyogenic differentiation of hESCs.Front Mol Biosci. 2024 Feb 6;11:1336336. doi: 10.3389/fmolb.2024.1336336. eCollection 2024. Front Mol Biosci. 2024. PMID: 38380430 Free PMC article.
-
Cardiomyogenesis Modeling Using Pluripotent Stem Cells: The Role of Microenvironmental Signaling.Front Cell Dev Biol. 2019 Aug 9;7:164. doi: 10.3389/fcell.2019.00164. eCollection 2019. Front Cell Dev Biol. 2019. PMID: 31448277 Free PMC article. Review.
-
Cardiac Development Long Non-Coding RNA (CARDEL) Is Activated during Human Heart Development and Contributes to Cardiac Specification and Homeostasis.Cells. 2024 Jun 18;13(12):1050. doi: 10.3390/cells13121050. Cells. 2024. PMID: 38920678 Free PMC article.
-
Reorganization of Metabolism during Cardiomyogenesis Implies Time-Specific Signaling Pathway Regulation.Int J Mol Sci. 2021 Jan 29;22(3):1330. doi: 10.3390/ijms22031330. Int J Mol Sci. 2021. PMID: 33572750 Free PMC article.
-
Global Assessment of Protein Translation in Mammalian Cells Using Polysome Fractionation.Methods Mol Biol. 2023;2666:157-164. doi: 10.1007/978-1-0716-3191-1_12. Methods Mol Biol. 2023. PMID: 37166664
References
Data Citations
-
- Robert A., Stimamiglio M. 2018. FlowRepository. FR-FCM-ZYX8
-
- 2018. NCBI Sequence Read Archive. SRP150416
-
- Pereira I. T., et al. . 2018. figshare. https://doi.org/10.6084/m9.figshare.c.4208357 - DOI
References
-
- Matoulkova E., Michalova E., Vojtesek B. & Hrstka R. The role of the 3′ untranslated region in post-transcriptional regulation of protein expression in mammalian cells. RNA Biol. 9, 563–576 (2012). - PubMed
-
- Sonenberg N. & Hinnebusch A. G. New Modes of Translational Control in Development, Behavior, and Disease. Mol. Cell 28, 721–729 (2007). - PubMed
-
- Tian Q. et al. Integrated Genomic and Proteomic Analyses of Gene Expression in Mammalian Cells. Mol. Cell. Proteomics 3, 960–969 (2004). - PubMed
-
- Sunnerhagen P. Cytoplasmatic post-transcriptional regulation and intracellular signalling. Mol. Genet. Genomics 277, 341–355 (2007). - PubMed
Publication types
MeSH terms
Associated data
LinkOut - more resources
Full Text Sources
Other Literature Sources
