Detrimental Role of miRNA-144-3p in Intracerebral Hemorrhage Induced Secondary Brain Injury is Mediated by Formyl Peptide Receptor 2 Downregulation Both In Vivo and In Vitro
- PMID: 30511586
- PMCID: PMC6686441
- DOI: 10.1177/0963689718817219
Detrimental Role of miRNA-144-3p in Intracerebral Hemorrhage Induced Secondary Brain Injury is Mediated by Formyl Peptide Receptor 2 Downregulation Both In Vivo and In Vitro
Abstract
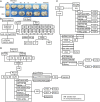
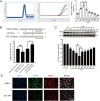
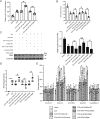
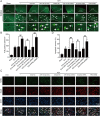
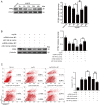
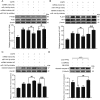
Although microRNA-144-3p (miRNA-144-3p) has been shown to suppress tumor proliferation and invasion, its function in intracerebral hemorrhage (ICH)-induced secondary brain injury (SBI) remains unclear. Thus, this study was designed to investigate the role of miRNA-144-3p in ICH. To accomplish this, we used adult male Sprague-Dawley rats to establish an in vivo ICH model by injecting autologous blood, while cultured primary rat cortical neurons were exposed to oxyhemoglobin (OxyHb) to mimic ICH in vitro. To examine the role of miRNA-144-3p in ICH-induced SBI, we used an miRNA-144-3p mimic and inhibitor both in vivo and in vitro. Following ICH induction, we found miRNA-144-3p expression to increase. Additionally, we predicted the formyl peptide receptor 2 (FPR2) to be a potential miRNA-144-3p target, which we validated experimentally, with FPR2 expression downregulated when miRNA-144-3p was upregulated. Furthermore, elevated miRNA-144-3p levels aggravated brain edema and neurobehavioral disorders and induced neuronal apoptosis via the downregulation of FPR2 both in vivo and in vitro. We suspected that these beneficial effects provided by FPR2 were associated with the PI3K/AKT pathway. We validated this finding by overexpressing FPR2 while inhibiting PI3K/AKT in vitro and in vivo. In conclusion, miRNA-144-3p aggravated ICH-induced SBI by targeting and downregulating FPR2, thereby contributing to neurological dysfunction and neural apoptosis via PI3K/AKT pathway activation. These findings suggest that inhibiting miRNA-144-3p may offer an effective approach to attenuating brain damage incurred after ICH and a potential therapy to improve ICH-induced SBI.
Keywords: apoptosis; formyl peptide receptor 2; intracerebral hemorrhage; microRNA-144-3p.
Conflict of interest statement
Figures


Similar articles
-
MicroRNA-126-3p attenuates blood-brain barrier disruption, cerebral edema and neuronal injury following intracerebral hemorrhage by regulating PIK3R2 and Akt.Biochem Biophys Res Commun. 2017 Dec 9;494(1-2):144-151. doi: 10.1016/j.bbrc.2017.10.064. Epub 2017 Oct 14. Biochem Biophys Res Commun. 2017. PMID: 29042193
-
miR-27a-3p protects against blood-brain barrier disruption and brain injury after intracerebral hemorrhage by targeting endothelial aquaporin-11.J Biol Chem. 2018 Dec 28;293(52):20041-20050. doi: 10.1074/jbc.RA118.001858. Epub 2018 Oct 18. J Biol Chem. 2018. PMID: 30337368 Free PMC article.
-
Activated WNK3 induced by intracerebral hemorrhage deteriorates brain injury maybe via WNK3/SPAK/NKCC1 pathway.Exp Neurol. 2020 Oct;332:113386. doi: 10.1016/j.expneurol.2020.113386. Epub 2020 Jun 23. Exp Neurol. 2020. PMID: 32589890
-
Targeting the multifaceted roles of mitochondria in intracerebral hemorrhage and therapeutic prospects.Biomed Pharmacother. 2022 Apr;148:112749. doi: 10.1016/j.biopha.2022.112749. Epub 2022 Feb 24. Biomed Pharmacother. 2022. PMID: 35219118 Review.
-
MicroRNAs as biomarkers in spontaneous intracerebral hemorrhage: A systematic review of recent clinical evidence.Clin Neurol Neurosurg. 2022 Feb;213:107130. doi: 10.1016/j.clineuro.2022.107130. Epub 2022 Jan 14. Clin Neurol Neurosurg. 2022. PMID: 35066247 Review.
Cited by
-
Formylpeptide receptor 2: Nomenclature, structure, signalling and translational perspectives: IUPHAR review 35.Br J Pharmacol. 2022 Oct;179(19):4617-4639. doi: 10.1111/bph.15919. Epub 2022 Jul 29. Br J Pharmacol. 2022. PMID: 35797341 Free PMC article. Review.
-
Functions of resolvin D1-ALX/FPR2 receptor interaction in the hemoglobin-induced microglial inflammatory response and neuronal injury.J Neuroinflammation. 2020 Aug 14;17(1):239. doi: 10.1186/s12974-020-01918-x. J Neuroinflammation. 2020. PMID: 32795323 Free PMC article.
-
MicroRNA-126-3p Attenuates Intracerebral Hemorrhage-Induced Blood-Brain Barrier Disruption by Regulating VCAM-1 Expression.Front Neurosci. 2019 Aug 16;13:866. doi: 10.3389/fnins.2019.00866. eCollection 2019. Front Neurosci. 2019. PMID: 31474826 Free PMC article.
-
Loss of MIC60 Aggravates Neuronal Death by Inducing Mitochondrial Dysfunction in a Rat Model of Intracerebral Hemorrhage.Mol Neurobiol. 2021 Oct;58(10):4999-5013. doi: 10.1007/s12035-021-02468-w. Epub 2021 Jul 7. Mol Neurobiol. 2021. PMID: 34232477
-
Neurovascular Units and Neural-Glia Networks in Intracerebral Hemorrhage: from Mechanisms to Translation.Transl Stroke Res. 2021 Jun;12(3):447-460. doi: 10.1007/s12975-021-00897-2. Epub 2021 Feb 24. Transl Stroke Res. 2021. PMID: 33629275 Review.
References
-
- Schlunk F, Greenberg SM. The pathophysiology of intracerebral hemorrhage formation and expansion. Transl Stroke Res. 2015;6(4):257–263. - PubMed
-
- Jiang B, Li L, Chen Q, Tao Y, Yang L, Zhang B, Zhang JH, Feng H, Chen Z, Tang J, Zhu G. Role of glibenclamide in brain injury after intracerebral hemorrhage. Transl Stroke Res. 2017;8(2):183–193. - PubMed
Publication types
MeSH terms
Substances
LinkOut - more resources
Full Text Sources
Molecular Biology Databases

