. 2018 Nov 30;8(1):17477.
doi: 10.1038/s41598-018-35392-6.

Alpha-tubulin acetyltransferase/MEC-17 regulates cancer cell migration and invasion through epithelial-mesenchymal transition suppression and cell polarity disruption

Affiliations

Alpha-tubulin acetyltransferase/MEC-17 regulates cancer cell migration and invasion through epithelial-mesenchymal transition suppression and cell polarity disruption

Cheng-Che Lee et al. Sci Rep. .

Abstract

MEC-17, a newly identified alpha-tubulin-N-acetyltransferase 1, serves as the major α-tubulin acetyltransferase to promote α-tubulin acetylation in vitro and in vivo. Alteration of α-tubulin acetylation may be involved in morphology regulation, cell migration, and tumour metastasis. However, MEC-17's role in cell physiology and its effect on epithelial-mesenchymal transition (EMT) and cell polarity remain elusive. In the present study, we characterized the overexpressed or downregulated cell models through gene targeting as MEC-17 gain- or loss-of-function. Overexpression of MEC-17 enhanced the cell spreading area, suppressed pseudopods formation in a three-dimensional (3D) culture system, and inhibited cancer cell migratory and invasive ability and tumour metastasis by orthotopic lung cancer animal model. Furthermore, morphological change and migration inhibition of cancer cells were accompanied by EMT repression, Golgi reorientation, and polarity disruption caused by alteration of cdc42 activity via a decrease in Rho-GAP, ARHGAP21. By contrast, a reduction in endogenous MEC-17 accelerated the pseudopods formation and EMT, and facilitated cell migration and invasion. These results demonstrated the crucial role of MEC-17 in the modulation of intrinsic cell morphogenesis, migration, and invasive function through regulation of EMT and cell polarity.


Conflict of interest statement

The authors declare no competing interests.

Figures

Figure 1
Figure 1
Overexpression of MEC-17 increases α-tubulin acetylation and cell spreading area but decreases pseudopods. (A) Western blot analysis shows the protein level of MEC-17 and tubulin acetylation in untransduced (A549 parental) and vector control (vector Ctrl), scrambled control (scrambled Ctrl), and MEC-17-transduced A549 cells (MEC-17-OE). The expression of MEC-17 in the MEC-17-transduced A549 cells is the highest. GAPDH served as a loading control, and GFP was present in the transduced control. The relative protein intensities were shown. Uncropped blots are displayed in the supplementary information (Supplementary Fig. S2). (B) The representative immunofluorescent images show the cell morphology and level of tubulin acetylation. A549 cells were transduced with vector control, scrambled control, or MEC-17-overexpressed plasmid DNA encoding with GFP. The Ac-α-Tu signals were presented as MEC-17 overexpressed cells. Scale bar, 10 μm. The representative bar graph showing the quantification of the cell spreading area demonstrates that MEC-17 overexpression increased the cell spreading area compared with the scrambled and vector control groups. ***P < 0.001 in a one-way ANOVA. (C) The representative GFP immunofluorescent images show the morphology of A549 cells embedded in collagen (3D culture) transduced with the MEC-17 construct or a vector control. Scale bar, 10 μm. The representative bar graphs showing the quantification of primary pseudopods and pseudopod extension (b/a ratio) demonstrate that MEC-17 overexpression reduced the pseudopod number and extension compared with the vector control group. (n = 21 for vector control; n = 29 for MEC-17-overexpression). ***P < 0.001 in a one-way ANOVA.
Figure 2
Figure 2
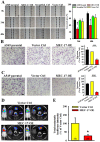
Overexpression of MEC-17 attenuates cell migration and invasion but also tumour metastasis. (A) The representative images of wound-healing assay showing the cell-covered area of A549 cells untransduced or transduced with vector control, scrambled control, or MEC-17-overexpressed constructs after scratching with a pipette tip for 0, 24, and 48 h revealed that MEC-17 attenuates cell migration ability. The representative bar graphs showing the quantification of cell migration ability were displayed by measuring the distance between the front edge of cell movement for each cell condition at 24 and 48 h. The percentage of the covered area represents the degree of cell migration. Overexpression of MEC-17 downregulated cell migration ability compared with parental, scrambled, and vector control cells. Scale bar, 100 μm. **P < 0.01 in a one-way ANOVA. (B) The representative images of Transwell assay showing the A549 cell untransduced or transduced with vector control or MEC-17-overexpressed constructs penetrated the lower surface of the filter stained with Giemsa. MEC-17-overexpressed A549 cells exhibited inhibition of migration. Scale bar, 100 μm. The representative bar graph showing the quantification of migratory cells demonstrated that overexpression of MEC-17 decreased cell migration compared with the vector control group. ***P < 0.001 in a one-way ANOVA. (C) The representative images of Transwell assay showing the A549 cell untransduced or transduced with vector control and MEC-17-overexpressed constructs penetrated through the Matrigel to the other surface of the filter and stained with Giemsa. MEC-17-overexpressed A549 cells show suppression of invasion. Scale bar, 100 μm. The representative bar graph showing the quantification of invasive cells demonstrated that overexpression of MEC-17 decreased cell invasion compared with the vector control group. ***P < 0.001 by one-way ANOVA. (D) The representative bioluminescent images of tumour growth and metastasis in orthotopic lung cancer model for 4 weeks of inoculation show the A549-Luc C8 cell stably expressing vector control (upper panels) or MEC-17-overexpression (bottom panels). (E) The representative bar graphs showing the quantification of tumour metastatic ability were displayed by measuring the luciferin signals. MEC-17 attenuated tumour metastatic ability compared with the vector control group. *P < 0.05 in a one-way ANOVA.
Figure 3
Figure 3
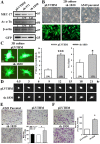
Loss of endogenous MEC-17 induces pseudopods formation and promotes cell migration and invasion. (A) Western blot analysis showed the protein level of MEC-17 and tubulin acetylation, in vector control (pLVTHM) and two MEC-17 shRNA transduced cells (sh-371, sh-1830). Beta-actin served as the internal control. GFP was used as the transduction control. The relative protein intensities were shown. Uncropped blots are displayed in the supplementary information (Supplementary Fig. S2). (B) The representative images show the cell morphology of A549 cells transduced with or without pLVTHM or MEC-17-shRNA (sh-1830) plasmid DNA encoding with GFP under the 2D culture condition (top panels, bright field; bottom panels, GFP fluorescence). Scale bar, 10 μm. (C) The representative GFP immunofluorescent images showing the morphology of A549 cells stably expressing with the pLVTHM or MEC-17 shRNA (sh-1830) were embedded in collagen (3D). A decrease in MEC-17 induced the elongated morphology with pseudopod protrusions of A549 cells at 24 h. Scale bar, 10 μm. The representative quantified bar graphs of primary pseudopods and pseudopod extension (b/a ratio) show that MEC-17 knockdown enhanced the pseudopod number and extension area compared with the pLVTHM group. (n = 14 for pLVTHM, n = 11 for sh-1830). ***P < 0.001, *P < 0.05 in a one-way ANOVA. (D) Time-lapse micrographs showing the dynamic extension and retraction of pseudopod protrusions in the 3D culture. Decrease of MEC-17 increased pseudopod protrusions within 24 h. (E) The representative images of Transwell assay showing the A549 cell untransduced or transduced with pLVTHM or sh-1830 constructs penetrated to the lower surface of the filter and stained with Giemsa. Scale bar, 100 μm. The representative bar graph showing the quantification of migratory cells demonstrated that MEC-17 knockdown promoted the migration ability compared with the pLVTHM vector control group. *P < 0.05 in a one-way ANOVA. (F) The representative images of the Matrigel-coated Transwell assay show the A549 cell transduced with pLVTHM or sh-1830 constructs penetrated to the lower surface of the filter and stained with Giemsa. Scale bar, 100 μm. The representative bar graph showing the quantification of invasive cells demonstrated that MEC-17 knockdown promoted the invasive ability compared with the pLVTHM vector control group. *P < 0.05 by one-way ANOVA.
Figure 4
Figure 4
MEC-17 modulates cell motility through EMT suppression. (A) Western blots showed the protein levels of vimentin, N-cadherin, E-cadherin, MEC-17, and acetyl-α-tubulin in scrambled control or vector control and MEC-17-overexpressed A549 cells. Beta-actin served as the internal control. Representative bar graph quantification depicting levels of vimentin, N-cadherin and E-cadherin showed the repression of EMT process in MEC-17-overexpressed A549 cells. *P < 0.05, **P < 0.01 in a one-way ANOVA. Uncropped blots are displayed in the supplementary information (Supplementary Fig. S3). (B) The representative doubling immunofluorescence images show the intensity of vimentin (red, top panels) and cell morphological marker GFP (bottom panels) in A549 cells stably expressing the vector control or MEC-17-overexpressed constructs. Scale bar, 20 μm. (C) The representative doubling immunofluorescence images show the intensity of E-cadherin (E-cad, red, top panels) and cell morphological marker GFP (bottom panels) in A549 cells stably expressing the vector control or MEC-17-overexpressed constructs. Scale bar, 20 μm. (D) Western blots show the protein levels of vimentin, N-cadherin, E-cadherin, MEC-17, and acetyl-α-tubulin from pLVTHM and MEC-17-knockdown (sh-1830) A549 cells lysts. Beta-actin served as the internal control. Representative bar graph quantification depicting amounts of vimentin, N-cadherin and E-cadherin showed the promotion of EMT process in MEC-17-knockdown A549 cells. *P < 0.05, **P < 0.01 in a one-way ANOVA. Uncropped blots are displayed in the supplementary information (Supplementary Fig. S3). (E) The representative doubling immunofluorescence images show the intensity of vimentin (red, top panels) in A549 cells stably expressing the pLVTHM or sh-1830 constructs. The GFP fluorescence images (bottom panels) were used for transduction control and morphology of A549 cells. Scale bar, 20 μm. (F) The representative doubling immunofluorescence images show the intensity of E-cadherin (E-cad, red, top panels) in A549 cells stably expressing the pLVTHM or sh-1830 constructs. The GFP fluorescence images (bottom panels) were used for transduction control and morphology of A549 cells. Scale bar, 20 μm.
Figure 5
Figure 5
Overexpression of MEC-17 disrupts the specification of cell polarity and increases GM130 expression. (A) The representative immunofluorescence images showing the A549 cells untransduced or transduced with vector control, or MEC-17-overexpressed constructs after scratching with a pipette tip for 24 h were immunostained with antibodies to the Golgi marker (GM130), GFP and nucleus marker, DAPI. Red, green, and blue staining corresponds to GM130, GFP, and DAPI staining, respectively. Scale bar, 20 μm. Representative magnified images were displayed the dispersed and randomized in orientation of GM130 protein staining in MEC-17-overexpressed A549 cells compared with the vector or parental groups. The quantitative analysis of GM130-condensed cells along the scratch area was shown in the bar graph plot. The proportion of polarized cells in MEC-17-overexpressed A549 cells was lower than that in the vector and parental control groups. ***P < 0.001 in a one-way ANOVA. (B) Western blots show the protein levels of GM130, MEC-17, acetyl-α-tubulin from scrambled control, vector control, and MEC-17-overexpressed A549 cell lysts. MEC-17 and Ac-α-tubulin were used to control MEC-17 overexpression. Beta-actin served as the internal control. The representative bar graph shows the quantified intensity of GM130 expression in A549 cells stably expressing scrambled control, vector control, and MEC-17-overexpressed constructs. **P < 0.01 in a one-way ANOVA. Uncropped blots are displayed in the supplementary information (Supplementary Fig. S3). (C) The time-lapse microscopic images showing the dynamic cell motility and corresponding trajectory illustrate that MEC-17 overexpression inhibited cell movement compared with the parental and vector control groups within 8 h. Scale bar, 20 μm.
Figure 6
Figure 6
MEC-17 can increase cdc42 activity and suppress ARHGAP21 expression. (A) Representative Western blots and corresponding bar graph quantification show the level of cdc42-GTP (cdc42 activity) in parental, scrambled control, vector control, and MEC-17-overexpressed A549 cells. The total cdc42 and MEC-17 were used as internal and transduced controls, respectively. Beta-actin served as the loading control to display equal amounts of protein. *P < 0.05 in a one-way ANOVA. Uncropped blots are displayed in the supplementary information (Supplementary Fig. S4). (B) Representative Western blots and corresponding bar graph quantification show the level of cdc42-GTP (cdc42 activity) in parental A549 cells or stably expressing pLVTHM or MEC-17-shRNA groups. *P < 0.05 in a one-way ANOVA. Uncropped blots are displayed in the supplementary information (Supplementary Fig. S4). (C) The representative Western blots and corresponding bar graph quantification show the expression of ARHGAP21 in parental, scrambled control, vector control, and MEC-17-overexpressed A549 cells. Beta-actin served as the internal control. *P < 0.05 in a one-way ANOVA. Uncropped blots are displayed in the supplementary information (Supplementary Fig. S4). (D) Representative Western blots and corresponding bar graph quantification show the expression of ARHGAP21 in parental A549 cells or stably expressing pLVTHM and MEC-17-shRNA groups. *P < 0.05 in a one-way ANOVA. Uncropped blots are displayed in the supplementary information (Supplementary Fig. S4).
Figure 7
Figure 7
Pharmacological inhibition of cdc42 activity rescued MEC-17-induced suppression of EMT. (A) The representative Western blots show the protein levels of vimentin, MEC-17, and acetyl-α-tubulin in vector control and MEC-17-overexpressed A549 cells after treatment with TGFβ1 (20 ng/mL) for 48 h. Beta-actin served as the internal control. The relative vimentin intensities normalized to vector control group were shown. Uncropped blots are displayed in the supplementary information (Supplementary Fig. S5). (B) The representative Western blots show the protein levels of vimentin, MEC-17, and acetyl-α-tubulin in vector control or MEC-17-overexpressed A549 cells after treatment with the cdc42 inhibitor CASIN (5 μM) for 48 h. Beta-actin served as the internal control. The relative vimentin intensities normalized to vector control group were shown. Uncropped blots are displayed in the supplementary information (Supplementary Fig. S5).
Figure 8
Figure 8
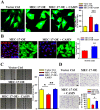
Blockage of cdc42 activity restored MEC-17-induced cell polarity disruption, spreading area enhancement, and migration attenuation. (A) The representative immunofluorescent images show the cell morphology of A549 cells transduced with vector control or MEC-17-overexpressed plasmid DNA in the presence or absence of CASIN. Scale bar, 20 μm. The representative bar graph showing the quantification of the cell spreading area demonstrated that inhibition of cdc42 activity abolished the MEC-17-induced increased cell spreading area compared with the MEC-17-overexpressed group. ***P < 0.001 in a one-way ANOVA. (B) The representative immunofluorescence images showing the A549 cells transduced with MEC-17-overexpressed constructs in the presence or absence of CASIN after scratching with a pipette tip for 24 h were immunostained with antibodies of GM130, GFP, and DAPI. Scale bar, 20 μm. The representative bar graphs showing the quantitative analysis of GM130-condensed cells along the scratch area illustrated that the lower proportion of polarized cells in MEC-17-overexpressed A549 cells is rescued under application of the cdc42 inhibitor CASIN. **P < 0.01 in a one-way ANOVA. (C) The representative images of wound-healing assay showing the cell-covered area of A549 cells transduced with vector control or MEC-17-overexpressed constructs in the presence or absence of CASIN after scratching with a pipette tip at 0 and 48 h demonstrated that diminished cdc42 activity blocked the MEC-17-induced attenuation of cell migration. The representative bar graphs showing the quantification of cell migration ability were displayed by measuring the distance between the front edge of cell movement for each cell condition at 48 h. Scale bar, 100 μm. *P < 0.05, **P < 0.01 in a one-way ANOVA. (D) The representative images of Transwell migration assay showing the A549 cell transduced with vector control or MEC-17-overexpressed constructs in the presence or absence of CASIN penetrated the lower surface of the filter stained with Giemsa. Scale bar, 100 μm. The representative bar graph showing the quantification of migratory cells demonstrated that suppression of cdc42 activity restored MEC-17-induced inhibition of cell migration. ***P < 0.001 in a one-way ANOVA.

Similar articles

Cited by

References

    1. Gu S, et al. Loss of α-Tubulin Acetylation Is Associated with TGF-β-induced Epithelial-Mesenchymal Transition. J Biol Chem. 2016;291:5396–405. doi: 10.1074/jbc.M115.713123. - DOI - PMC - PubMed
    1. Hay ED. An overview of epithelio-mesenchymal transformation. Acta Anatomica. 1995;154:8–20. doi: 10.1159/000147748. - DOI - PubMed
    1. Barrallo-Gimeno A, Nieto M. The Snail genes as inducers of cell movement and survival: implications in development and cancer. Development. 2005;132:3151–61. doi: 10.1242/dev.01907. - DOI - PubMed
    1. Moreno-Bueno G, Portillo F, Cano A. Transcriptional regulation of cell polarity in EMT and cancer. Oncogene. 2008;27:6958–69. doi: 10.1038/onc.2008.346. - DOI - PubMed
    1. Thiery J. Epithelial-mesenchymal transitions in development and pathologies. Curr Opin Cell Biol. 2003;15:740–46. doi: 10.1016/j.ceb.2003.10.006. - DOI - PubMed

Publication types