. 2018 Nov 30;14(11):e1007423.
doi: 10.1371/journal.ppat.1007423. eCollection 2018 Nov.

Ym1 induces RELMα and rescues IL-4Rα deficiency in lung repair during nematode infection

Affiliations

Ym1 induces RELMα and rescues IL-4Rα deficiency in lung repair during nematode infection

Tara E Sutherland et al. PLoS Pathog. .

Abstract

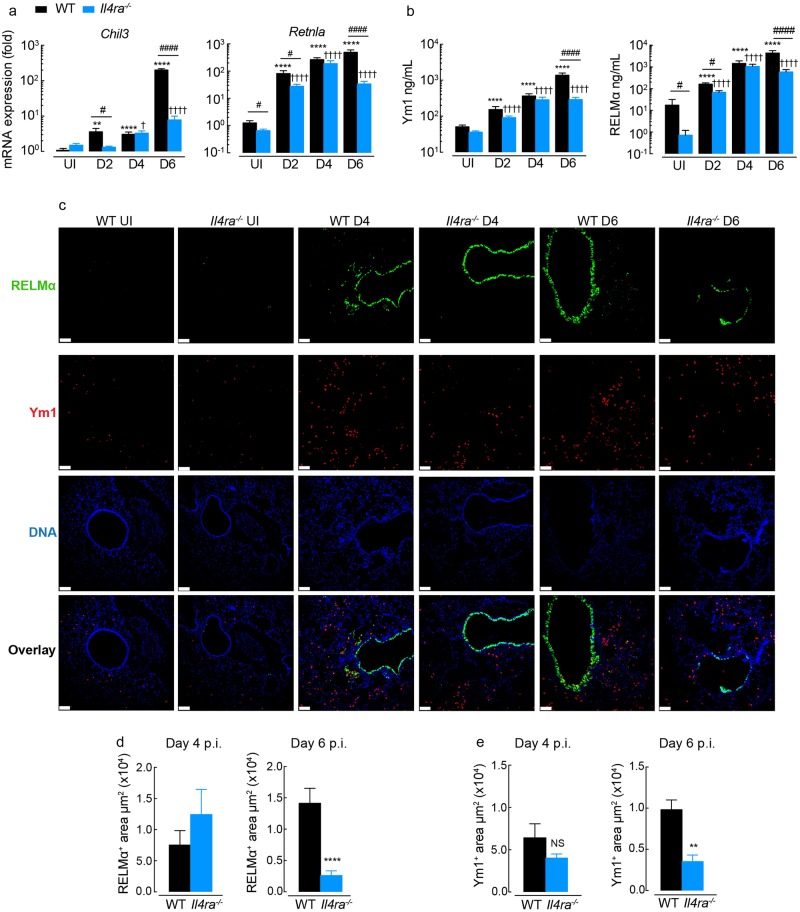
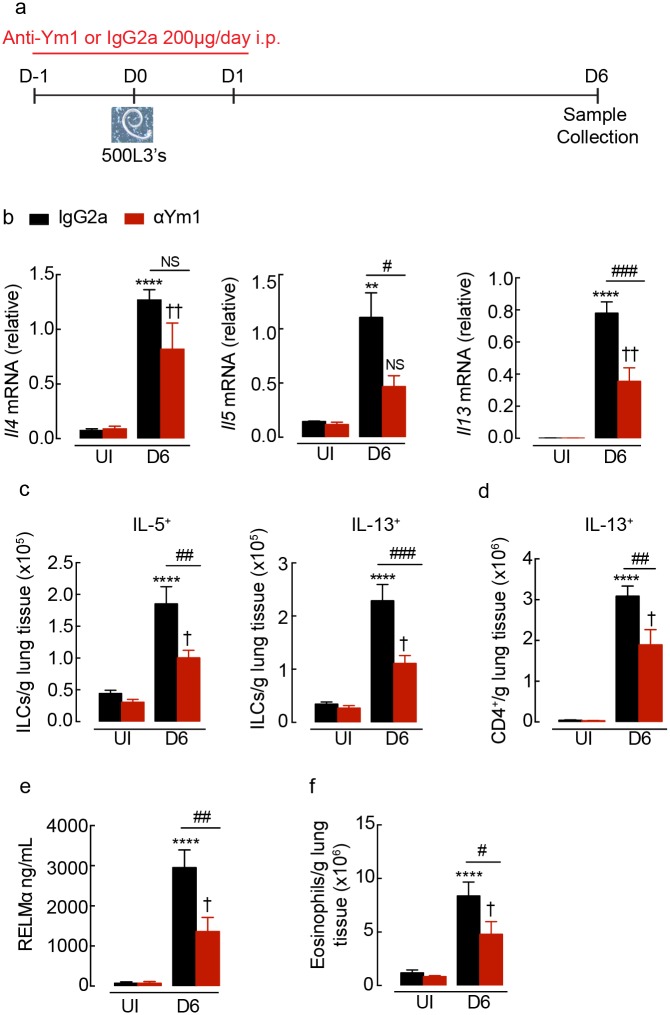
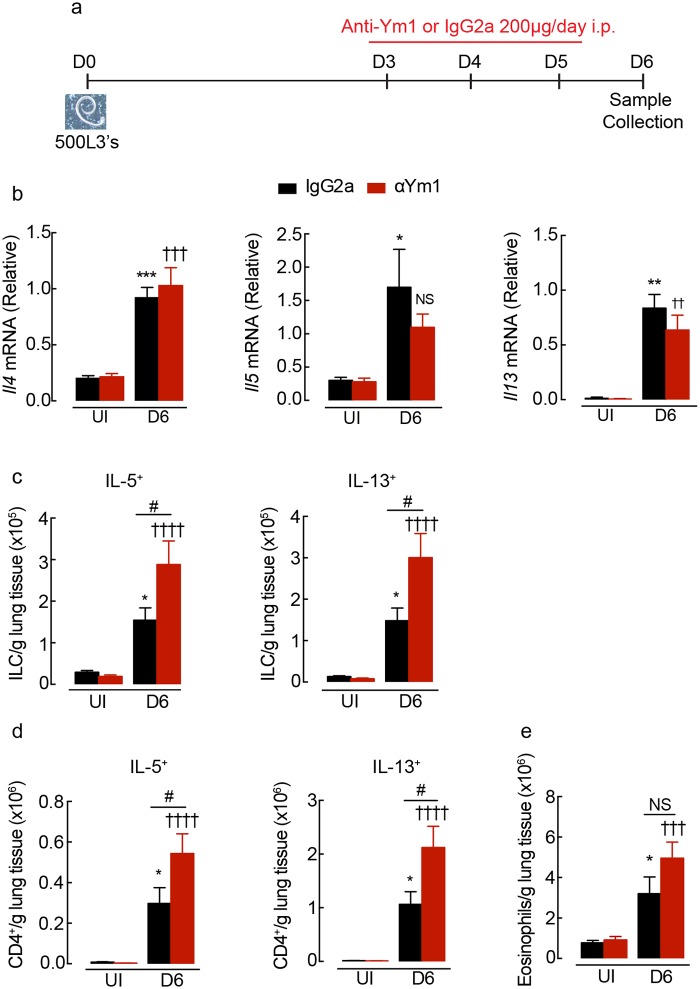
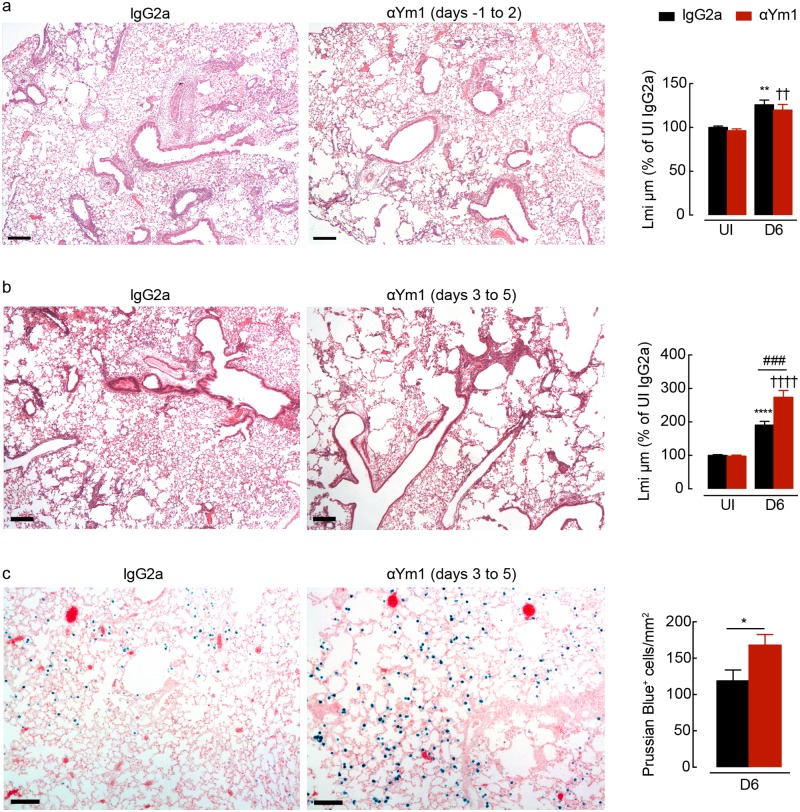
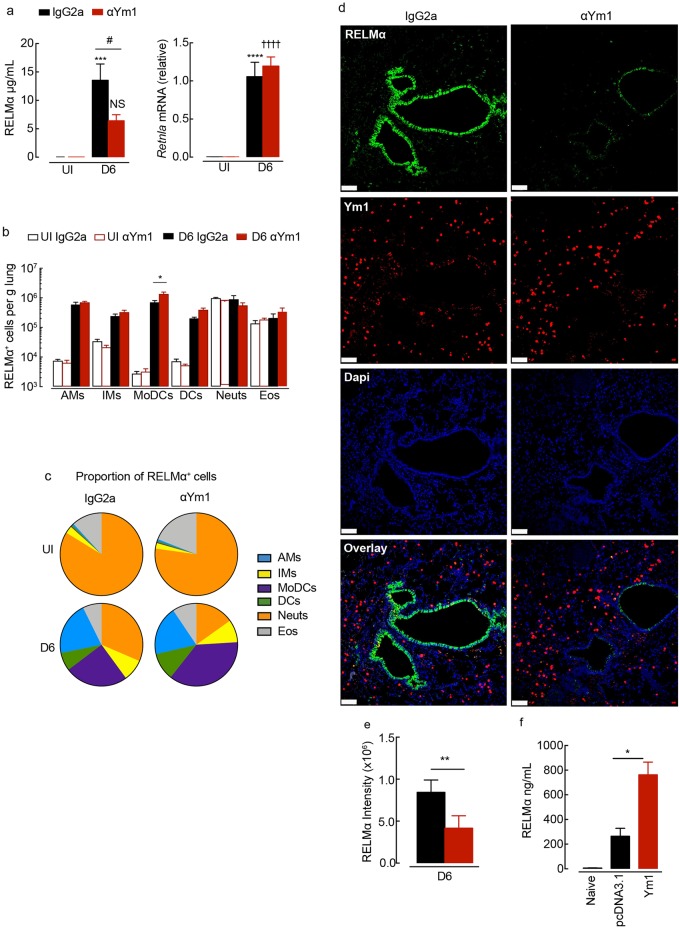
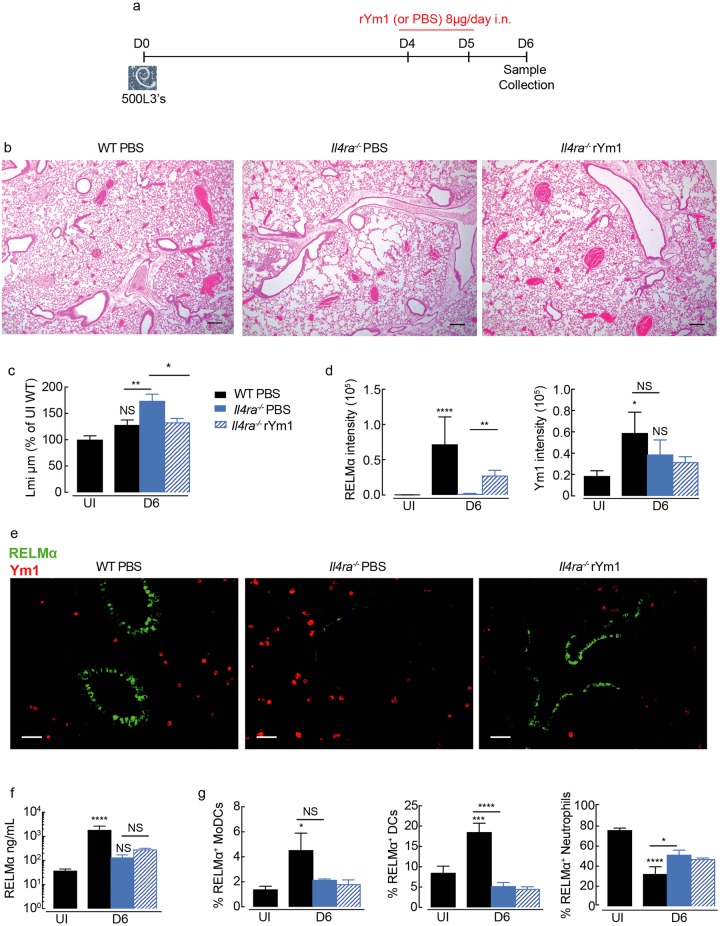
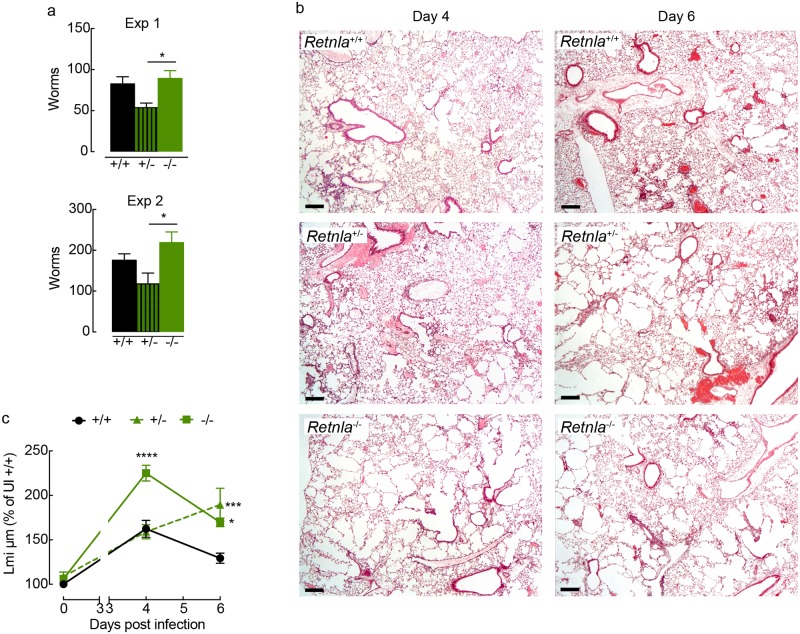
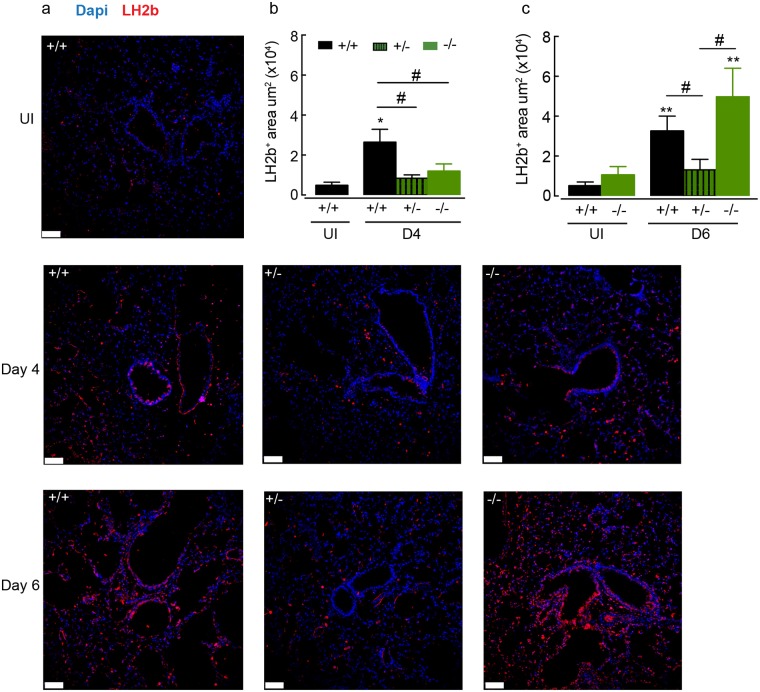
Ym1 and RELMα are established effector molecules closely synonymous with Th2-type inflammation and associated pathology. Here, we show that whilst largely dependent on IL-4Rα signaling during a type 2 response, Ym1 and RELMα also have IL-4Rα-independent expression patterns in the lung. Notably, we found that Ym1 has opposing effects on type 2 immunity during nematode infection depending on whether it is expressed at the time of innate or adaptive responses. During the lung migratory stage of Nippostrongylus brasiliensis, Ym1 promoted the subsequent reparative type 2 response but once that response was established, IL-4Rα-dependent Ym1 was important for limiting the magnitude of type 2 cytokine production from both CD4+ T cells and innate lymphoid cells in the lung. Importantly, our study demonstrates that delivery of Ym1 to IL-4Rα deficient animals drives RELMα production and overcomes lung repair deficits in mice deficient in type 2 immunity. Together, Ym1 and RELMα, exhibit time and dose-dependent interactions that determines the outcome of lung repair during nematode infection.


Conflict of interest statement

The authors have declared that no competing interests exist and that no author has a financial or non-financial professional or personal relationship with GlaxoSmithKlein.

Figures

Fig 1
Fig 1. The expression of Ym1 and RELMα in the lungs of mice.
(a) Amplification of Chil3 and Retnla mRNA in lung tissue from BALB/c WT or Il4ra-/- mice left uninfected (UI) or infected with N. brasiliensis (500 L3’s) and assessed at days 2, 4 and 6 post-infection (results are relative to uninfected WT, set as 1 (100); n = 12–6 per group; data are shown as mean ± sem; two-way ANOVA with Tukey multi-comparison test; NS not significant, ****P<0.0001 compared to UI wild-type (WT); ✝✝✝✝ P<0.0001 compared to UI Il4ra-/-; #P<0.05 and #### P<0.0001 wild-type compared to Il4ra-/- mice; data pooled from 2 independent experiments). (b) Ym1 and RELMα levels in the BAL fluid from mice as in a. (c) Microscopy of lung sections from WT and Il4ra-/- BALB/c naive mice or mice infected with N. brasiliensis at day 4 and 6, stained with the DNA-binding dye (DAPI), blue; Ym1, red; and RELMα, green (scale bars, 70μm; images are representative of n = 6 of 2 independent experiments). (d) Quantification of the RELMα+ areas in lung sections stained in c (n = 6 per group; data are shown as mean ± sem; unpaired t test, ****P<0.0001; data representative of 2 independent experiments). (e) Quantification of the Ym1+ areas in lung sections stained from c (n = 6 per group; data are shown as mean ± sem; unpaired t test, NS not significant and **P<0.01; data representative of 2 independent experiments).
Fig 2
Fig 2. Innate Ym1 promotes type 2 cytokine production in the lung during N. brasiliensis infection.
(a) Time-line of infection with N. brasiliensis (500 L3’s) and dosing with anti-Ym1 or IgG2a. (b) Expression of Il4, Il5 and Il13 mRNA in whole lung tissue of uninfected (UI) or N. brasiliensis infected mice (D6) treated intraperitoneally with anti-Ym1 or IgG2a (n = 6 per group; data are shown as mean ± sem; two-way ANOVA with Sidak multi-comparison test; NS not significant, **P<0.01 ****P<0.0001 compared to UI IgG2a treated; ✝✝ P<0.01 compared to UI anti-Ym1; #P<0.05 and ### P<0.001 IgG2a infected compared to anti-Ym1 infected mice; data representative of 2 independent experiments). (c) The number of ILC2s expressing intracellular IL-5 or IL-13 within the lungs of mice as in b. Single cell lung suspensions were stimulated ex vivo with PMA and ionomycin, graphs show absolute number of cytokine positive cells per g of lung tissue (n = 6 per group; data are shown as mean ± sem; two-way ANOVA with Sidak multi-comparison test; ****P<0.0001 compared to UI IgG2a treated; ✝ P<0.05 compared to UI anti-Ym1; ##P<0.01 and ### P<0.001 IgG2a infected compared to anti-Ym1 infected mice; data representative of 2 independent experiments). (d) Expression of IL-13 in CD4+ T cells from mice as described in b. (e) RELMα levels secreted into the BAL of mice as in b (n = 6 per group; data are shown as mean ± sem; two-way ANOVA with Sidak multi-comparison test; ****P<0.0001 compared to UI IgG2a treated; ✝ P<0.05 compared to UI anti-Ym1; ##P<0.01 IgG2a infected compared to anti-Ym1 infected mice; data representative of 2 independent experiments). (f) Absolute number of eosinophils from lungs of mice as in b (n = 6 per group; data are shown as mean ± sem; two-way ANOVA with Sidak multi-comparison test; ****P<0.0001 compared to UI IgG2a treated; ✝ P<0.05 compared to UI anti-Ym1; #P<0.05 IgG2a infected compared to anti-Ym1 infected mice; data representative of 2 independent experiments).
Fig 3
Fig 3. Adaptive Ym1 limits type 2 cytokine production in the lung during infection.
(a) Time-line of infection with N. brasiliensis and dosing with anti-Ym1 or IgG2a. (b) Expression of Il4, Il5 and Il13 mRNA in whole lung tissue of uninfected (UI) or N. brasiliensis (500 L3’s) infected mice (D6) treated intraperitoneally with anti-Ym1 or IgG2a (n = 6 per group; data are shown as mean ± sem; two-way ANOVA with Sidak multi-comparison test; NS not significant, *P<0.05, **P<0.01 ***P<0.001 compared to UI IgG2a treated; ✝✝ P<0.01, ✝✝✝P<0.001 compared to UI anti-Ym1; data representative of 3 independent experiments). (c) The number of ILCs expressing intracellular IL-5 or IL-13 within the lungs of mice as in b. Single cell lung suspensions were stimulated ex vivo with PMA and ionomycin, graphs show absolute number of cytokine positive cells per g of lung tissue (n = 6 per group; data are shown as mean ± sem; two-way ANOVA with Sidak multi-comparison test; *P<0.05 compared to UI IgG2a treated; ✝✝✝P<0.001, ✝✝✝✝ P<0.0001 compared to UI anti-Ym1; NS not significant, #P<0.05 IgG2a infected compared to anti-Ym1 infected mice; data representative of 3 independent experiments). (d) Expression of IL-5 and IL-13 in CD4+ T cells from mice as described in b (n = 6 per group; data are shown as mean ± sem; two-way ANOVA with Sidak multi-comparison test; *P<0.05 compared to UI IgG2a treated; ✝✝✝✝ P<0.0001 compared to UI anti-Ym1; #P<0.05 IgG2a infected compared to anti-Ym1 infected mice; data representative of 3 independent experiments). (e) Absolute number of eosinophils from lungs of mice as in b (n = 6 per group; data are shown as mean ± sem; two-way ANOVA with Sidak multi-comparison test; *P<0.05 compared to UI IgG2a treated; ✝✝✝ P<0.001 compared to UI anti-Ym1; NS not significant, IgG2a infected compared to anti-Ym1 infected mice; data representative of 3 independent experiments).
Fig 4
Fig 4. Adaptive Ym1 is required for rapid repair of the lung following helminth infection.
(a) Microscopy of lung sections from mice uninfected or N. brasiliensis (500 L3’s) infected mice (day 0) treated intraperitoneally with anti-Ym1 or IgG2a (days -1 to +2) and collected at day 6, stained with hematoxylin and eosin (images are representative of n = 6, scale bars, 200μm; graph shows quantification of lung damage as linear means intercept (Lmi), data normalised to average Lmi in uninfected IgG2a treated mice, n = 6 per group; data are shown as mean ± sem; two-way ANOVA with Sidak multi-comparison test; **P<0.01 compared to UI IgG2a treated; ✝✝ P<0.01 compared to UI anti-Ym1; data representative of 2 independent experiments). (b) Microscopy of lung sections from mice uninfected or N. brasiliensis infected mice (day 0) treated intraperitoneally with anti-Ym1 or IgG2a (days 3 to 5) and collected at day 6, stained with hematoxylin and eosin (images are representative of n = 6, scale bars, 200μm; graph shows quantification of lung damage as linear means intercept (Lmi), data normalised to average Lmi in uninfected IgG2a treated mice, n = 6 per group; data are shown as mean ± sem; two-way ANOVA with Sidak multi-comparison test; ****P<0.0001 compared to UI IgG2a treated; ✝✝✝✝ P<0.0001 compared to UI anti-Ym1; ###P<0.001 IgG2a infected compared to anti-Ym1 infected mice; data representative of 3 independent experiments). (c) Microscopy of lung sections from mice as in b, stained with prussian blue. Graph shows quantification of the number of prussian blue positive cells per area of lung. (images are representative of n = 6, scale bars, 100μm, n = 6 per group; data are shown as mean ± sem; unpaired t test, *P<0.05; data representative of 3 independent experiments).
Fig 5
Fig 5. Ym1 stimulates epithelial-derived RELMα during infection with N. brasiliensis.
(a) RELMα levels in the BAL fluid or Retnla expression in lung tissue from mice uninfected (UI) or N. brasiliensis (500 L3’s) infected mice (D6) treated intraperitoneally with anti-Ym1 or IgG2a (days +3 to +5) and collected at day 6 (n = 6 per group; data are shown as mean ± sem; two-way ANOVA with Sidak multi-comparison test; ***P<0.001, ****P<0.0001 compared to UI IgG2a treated; NS not significant, ✝✝✝✝ P<0.0001 compared to UI anti-Ym1; #P<0.05 IgG2a infected compared to anti-Ym1 infected mice; data representative of 3 independent experiments). (b) Total numbers of RELMα+ myeloid cell populations per g of lung tissue from mice as in a, analysed by intracellular flow cytometry (n = 6 per group; data are shown as mean ± sem; level of RELMα positivity was set from cells stained with rabbit IgG isotype; two-way ANOVA with Sidak multi-comparison test; data representative of 3 independent experiments; AMs, alveolar macrophage; IMs, interstitial macrophage; MoDCs, monocyte derived dendritic cells; DCs, dendritic cells; Neuts, neutrophils; Eos, eosinophils. (c) Pie chart showing the proportion of different RELMα+ cell populations in lung myeloid cells from b. (d) Microscopy of lung sections from infected mice as in a stained with the DNA-binding dye (DAPI), blue; Ym1, red; and RELMα, green. (Images are representative of 6 individual mice per group; scale bars, 70μm). (e) Quantification of the fluorescent intensity of RELMα in lung sections stained from c (n = 6 per group; data are shown as mean ± sem; unpaired t test, **P<0.01; data representative of 2 independent experiments). (f) RELMα levels in the BAL fluid collected at 48hrs from BALB/c mice transfected intranasally with glucose or pcDNA3.1 or Ym1 plasmid (20μg) (n = 6–10 per group; data are shown as mean ± sem; one way ANOVA with Sidak multi comparison test, *P<0.05; data were pooled from 2 independent experiments).
Fig 6
Fig 6. Ym1 regulates tissue repair and RELMα independently of IL-4Rα.
(a) Time-line of infection with N. brasiliensis and dosing with rYm1 (8μg) or PBS. (b) Microscopy of lung sections from N. brasiliensis infected (250L3, s.c.) wild-type C57BL/6 or IL-4Rα-/- C57BL/6 mice (day 0) treated intranasally with recombinant Ym1 (8μg) or PBS (days 4 and 5) at day 6 post-infection, and stained with hematoxylin and eosin (images are representative of n = 5–6, scale bars, 200μm. (c) Quantification of lung damage as linear means intercept (Lmi), data normalised to average Lmi in uninfected wild-type PBS treated mice as in b, n = 6 per group; data are shown as mean ± sem; one-way ANOVA with Sidak multi-comparison test; NS not significant, *P<0.05 and **P<0.01 compared to UI PBS treated mice. (d) Quantification of the fluorescent intensity of RELMα and Ym1 in lung sections in e stained from mice as in b (n = 6 per group; data are shown as mean ± sem; one-way ANOVA with Sidak multi-comparison test, NS not significant, *P<0.05, **P<0.01 and ****P<0.0001). (e) Microscopy of lung sections from infected mice as in b stained with Ym1, red; and RELMα, green. (Images are representative of 5–6 individual mice per group; fluorescent intensity quantified in d; scale bars, 50μm). (f) RELMα levels in the BAL fluid collected from mice in b (n = 5–6 per group; data are shown as mean ± sem; one way ANOVA with Sidak multi comparison test, NS not significant, *P<0.05 and ****P<0.00001). (g) Frequency of RELMα+ myeloid cells in lung tissue from mice as in b, analysed by intracellular flow cytometry (n = 6 per group; data are shown as mean ± sem; level of RELMα positivity was set from cells stained with rabbit IgG isotype; MoDCs, monocyte-derived dendritic cells; DCs, dendritic cells.
Fig 7
Fig 7. RELMα is required for rapid repair of the lungs following infection with N. brasiliensis.
(a) The numbers of worms in the small intestine of littermate control +/+, +/- and -/- Retnla mice infected with N. brasiliensis (500 L3’s) counted at day 4 post-infection (n = 6–8 per group; data are shown as mean ± sem; one way ANOVA with Sidak multi comparison test, *P<0.05). (b) Microscopy of lung sections from littermate control Retnla mice uninfected or infected with N. brasiliensis collected at day 4 or day 6 post-infection, and stained with hematoxylin and eosin. (images are representative of n = 6–8 and 2 independent experiments, scale bars, 200μm) (c) Quantification of lung damage, calculated as linear means intercept and values normalised to Lmi in uninfected +/+ mice (n = 6–21 per group; data are shown as mean ± sem; two-way ANOVA with Sidak multi-comparison test; *P<0.05 and ***P<0.001 compared to Retnla +/+ infected mice; data are pooled from 2 independent experiments).
Fig 8
Fig 8. RELMα regulates expression of lysyl hydroxylase 2b during lung repair.
(a) Microscopy of lung sections from WT and Retnla littermate naive mice or mice infected with N. brasiliensis (500 L3’s; day 4 and day 6), stained with the DNA-binding dye (DAPI), blue and lysyl hydroxylase 2b (LH2b), red. (images are representative of n = 5–9 mice per group, scale bars, 70μm). Quantification of positive stained Lh2b area of (b) day 4 or (c) day 6 infected mice as in a (n = 5–9 per group; data are shown as mean ± sem; two-way ANOVA with Sidak multi-comparison test; *P<0.05 and **P<0.01 compared to UI Retnla+/+ mice; #P<0.05 compared to Retnla +/+ infected mice; data are representative from 2 independent experiments).

Similar articles

Cited by

References

    1. Allen JE, Sutherland TE. Host protective roles of type 2 immunity: parasite killing and tissue repair, flip sides of the same coin. Semin Immunol. 2014;26: 329–340. 10.1016/j.smim.2014.06.003 - DOI - PMC - PubMed
    1. Lawrence RA, Gray CA, Osborne J, Maizels RM. Nippostrongylus brasiliensis: cytokine responses and nematode expulsion in normal and IL-4-deficient mice. Exp Parasitol. 1996;84: 65–73. 10.1006/expr.1996.0090 - DOI - PubMed
    1. Barner M, Mohrs M, Brombacher F, Kopf M. Differences between IL-4R alpha-deficient and IL-4-deficient mice reveal a role for IL-13 in the regulation of Th2 responses. Curr Biol. 1998;8: 669–672. - PubMed
    1. Chen F, Liu Z, Wu W, Rozo C, Bowdridge S, Millman A, et al. An essential role for TH2-type responses in limiting acute tissue damage during experimental helminth infection. 2012;18: 260–266. 10.1038/nm.2628 - DOI - PMC - PubMed
    1. Raes G, De Baetselier P, Noël W, Beschin A, Brombacher F, Hassanzadeh Gh G. Differential expression of FIZZ1 and Ym1 in alternatively versus classically activated macrophages. J Leukoc Biol. 2002;71: 597–602. - PubMed

Publication types

MeSH terms