. 2019 Apr 1;151(4):435-451.
doi: 10.1085/jgp.201812234. Epub 2018 Nov 29.

Cadmium opens GluK2 kainate receptors with cysteine substitutions at the M3 helix bundle crossing

Affiliations

Cadmium opens GluK2 kainate receptors with cysteine substitutions at the M3 helix bundle crossing

Timothy J Wilding et al. J Gen Physiol. .

Abstract

Kainate receptors are ligand-gated ion channels that have two major roles in the central nervous system: they mediate a postsynaptic component of excitatory neurotransmission at some glutamatergic synapses and modulate transmitter release at both excitatory and inhibitory synapses. Accumulating evidence implicates kainate receptors in a variety of neuropathologies, including epilepsy, psychiatric disorders, developmental delay, and cognitive impairment. Here, to gain a deeper understanding of the conformational changes associated with agonist binding and channel opening, we generate a series of Cys substitutions in the GluK2 kainate receptor subunit, focusing on the M3 helices that line the ion pore and form the bundle-crossing gate at the extracellular mouth of the channel. Exposure to 50 µM Cd produces direct activation of homomeric mutant channels bearing Cys substitutions in (A657C), or adjacent to (L659C), the conserved SYTANLAAF motif. Activation by Cd is occluded by modification with 2-aminoethyl MTS (MTSEA), indicating that Cd binds directly and specifically to the substituted cysteines. Cd potency for the A657C mutation (EC50 = 10 µM) suggests that binding involves at least two coordinating residues, whereas weaker Cd potency for L659C (EC50 = 2 mM) implies that activation does not require tight coordination by multiple side chains for this substitution. Experiments with heteromeric and chimeric channels indicate that activation by Cd requires Cys substitution at only two of the four subunits within a tetrameric receptor and that activation is similar for substitution within subunits in either the A/C or B/D conformations. We develop simple kinetic models for the A657C substitution that reproduce several features of Cd activation as well as the low-affinity inhibition observed at higher Cd concentrations (5-20 mM). Together, these results demonstrate rapid and reversible channel activation, independent of agonist site occupancy, upon Cd binding to Cys side chains at two specific locations along the GluK2 inner helix.


Figures

Figure 1.
Figure 1.
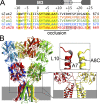
The M3 helix sequence conservation. (A) Alignment of ionotropic glutamate receptor subunit inner helix (M3) sequences. Numbers to the right denote position of the final residue from the N-terminal methionine. Homologous positions are numbered above the sequences relative to the first conserved residue (S = 1) of the nine–amino acid SYTANLAAF motif. Yellow highlights identical residues, and gray highlights positions of nonidentity within the GluN2 and GluK4/5 subfamilies. The A8 Lurcher site is marked with a red asterisk. In the closed conformation, the M3 helix extends to approximately +17 and +12 in the A/C and B/D configurations, respectively, as indicated by gray cylinders above the sequence. A horizontal line below the sequence indicates the closed conformation bundle crossing occlusion. (B) The GluK2 homology model based on the homomeric GluA2 AMPA receptor closed state x-ray structure. The A/C configurations are shown in green and blue; B/D configurations are shown in red and yellow. The bottom right box shows an expanded view of the linkage zone between the LBD and TMD of the B and D subunits. The top right box shows B and D subunit M3 helices with A8C and WT A7 and L10 side chains displayed.
Figure 2.
Figure 2.
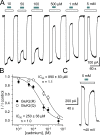
Cd inhibits WT GluK2(Q) and GluK2(R). (A) Whole-cell currents evoked by 10 µM kainate in an HEK cell transfected with GluK2(R). Kainate was applied as indicated by the open bars. Solid bars indicate coapplication of Cd at 10, 50, 100, and 500 µM and 1 and 5 mM. Holding potential is −80 mV. (B) Current (mean ± SEM) recorded during Cd coapplication plotted as a fraction of control current immediately before Cd exposure (five cells for Q and four cells for R). Smooth curves are the best fit of I/Icontrol = 100/(1 + ([Cd]/IC50)n), where IC50 is the concentration that produced half-maximal inhibition and n is the slope factor. (C) Outward current evoked by kainate in a different cell held at +40 mV was inhibited by brief exposure to 5 mM Cd as indicated by the solid bar.
Figure 3.
Figure 3.
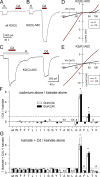
Cd activates kainate receptors with inner helix cysteine substitutions. (A) Whole-cell current evoked by 10 µM kainate (open bar) and no effect of 50 µM Cd alone (red bars) in an HEK cell transfected with WT GluK2(Q). (B) Currents evoked by exposure to kainate and Cd in a different cell transfected with GluK2(Q) A8C plotted at the same current scale. (C) Coapplication of 50 µM Cd and 10 µM kainate compared with Cd alone. In A–C, holding potential is −80 mV. (D and E) Current evoked by 10 µM kainate or 50 µM Cd during voltage ramps from −150 to +120 mV. (F) Current evoked by 50 µM Cd alone as a fraction of current evoked by 10 µM kainate alone (mean ± SEM, 4–114 cells per construct) for GluK2(Q) (open bars) and GluK2(R) (solid bars) WT or mutant, with Cys substitution at each position from W641C (−8) to V661C (+12). Crosses denote positions where exposure to either kainate or Cd failed to evoke any change in holding current. Symbols indicate current ratios significantly greater than (*) or less than (#) WT (P < 0.05, ANOVA on ranks, post hoc Dunn’s test). (G) Current evoked by coapplication of Cd and kainate as a fraction of kainate alone (4–21 cells per construct).
Figure 4.
Figure 4.
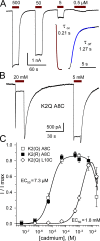
Concentration dependence of Cd activation. (A) Whole-cell currents evoked by 500, 50, 5, and 0.5 µM Cd alone in an HEK cell transfected with GluK2(Q) A8C. Inset shows exponential fits to the onset (red) and recovery (blue) phases of current evoked by 50 µM Cd shown on an expanded time scale. Holding potential is −80 mV. (B) Onset and recovery of low-affinity inhibition during exposure to 20 and 5 mM Cd in a different cell transfected with GluK2(Q) A8C. (C) Plot of steady-state current (mean ± SEM) as a fraction of the maximal Cd-evoked response. Smooth curve is the best simultaneous fit of I/Imax = (m/(1 + (EC50/[Cd])n))/(1 + ([Cd]/IC50)b) to the data for A8C substitution of both GluK2(Q) and GluK2(R), where EC50 = 7.3 ± 1.4 µM and IC50 = 25 ± 5.4 mM are the concentrations for half-maximal activation and inhibition, respectively; n = 1.6 ± 0.4 and b = 1.3 ± 0.4 are the slope factors; and m = 0.86 ± 0.03 is the maximal steady-state current. Individual fits to Q (11 cells) and R (12 cells) data sets were not statistically superior by F test. Cd activated GluK2(Q) L10C with weaker potency (EC50 = 1.8 ± 0.3 mM, n = 1.2 ± 0.2; IC50 = 26 ± 7.1 mM, b = 1.9 ± 0.5; m set to 1; 12 cells).
Figure 5.
Figure 5.
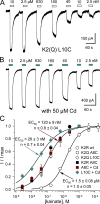
The M3 Cys substitutions increase agonist potency, and Cd coapplication has a differential effect on L10C versus A8C. (A) Whole-cell currents evoked by decreasing concentrations of kainate (open bars) from 10 µM to 2.5 nM in an HEK cell transfected with GluK2(Q) L10C. (B) In a different cell, the same agonist concentrations were applied together with 50 µM Cd (cyan bars). Note the increased responses to low doses. (C) Plots of current evoked by kainate (mean ± SEM) normalized to the maximal response for each condition. Smooth curve is the best fit of I/Imax = 1/(1 + (EC50/[kainate])n), where EC50 is the concentration for half-maximal activation and n is the slope factor. Activation of WT receptors is half-maximal at 1.5 µM (data taken from Wilding et al., 2005). Homomeric M3 A8C or L10C substitution increased kainate potency by ∼12.5-fold. Individual fits to the results for K2(Q) A8C (5 cells), K2(R) A8C (3 cells), and K2(Q) L10C (10 cells) were not significantly better than the simultaneous fit to all three data sets with EC50 = 120 ± 9 nM and n = 0.8 ± 0.04. Coapplication of 50 µM Cd to K2(Q) L10C (nine cells) produced an additional increase in apparent agonist potency of ∼4.5-fold (EC50 = 26 ± 3 nM), whereas agonist potency was unchanged with coapplication of 0.5 µM Cd to K2(Q) A8C (nine cells).
Figure 6.
Figure 6.
Synergistic activation by Cd and kainate at GluK2 L10C. (A and B) Whole-cell currents evoked by Cd alone (red bars), 10 µM kainate (open bars), or kainate plus Cd (cyan bars) in HEK cells expressing GluK2(Q) A8C (A) or GluK2(Q) L10C (B). Note that for the L10C substitution (B), current evoked by kainate plus Cd was larger than the sum of current evoked by kainate alone (black arrow) and Cd alone (red arrow). (C) Currents evoked by Cd alone and kainate plus Cd in the same cell plotted as a fraction of the current evoked by kainate alone for GluK2 A8C with either 5 µM Cd (open symbols, 10 cells for Q) or 50 µM Cd (20 cells; 13 for Q and 7 for R) and GluK2 L10C with.50 µM Cd (15 cells; 10 for Q and 5 for R). Results for individual cells are plotted in gray and connected by lines (open symbols are Q, and solid symbols are R); larger colored symbols plot mean ± SEM. Note the y-axis log scale. Asterisk denotes significant difference from Cd alone (P < 0.00003, paired t test).
Figure 7.
Figure 7.
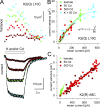
Cd increases open probability. (A) Points show mean current (bottom) and current variance (top) for whole-cell responses evoked by 50 and 500 µM Cd (dark and bright red, respectively), 10 µM kainate (green), and 10 µM kainate + 50 µM Cd (cyan) in an HEK cell transfected with GluK2(Q) L10C. Holding potential is −80 mV. (B and C) Plots of current variance versus mean current evoked by 10 µM kainate, 50 or 500 µM Cd alone, or 10 µM kainate plus 50 µM Cd in HEK cells expressing homomeric GluK2(Q) L10C (B) or GluK2(R) A8C (C). Note the variance data in A and B are from the same cell and plotted on the same variance scale, in A as a function of time and in B as a function of the mean current values for each time segment. Smooth curves in B are the best fits of the parabolic equation σ2 = i * I − (I2/N), where σ2 is variance, I is the mean macroscopic current, i is the unitary current (∼0.1 pA), N is the number of channels (∼12,000), and maximum Po = Imax/(i * N) (∼0.5). Smooth curves in C are best straight line fits with slope = i (12 fA for kainate and 4 fA for 50 and 500 µM Cd).
Figure 8.
Figure 8.
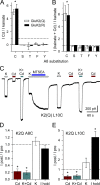
Cd sensitivity requires Cys substitution. (A and B) Summary plots of current (mean ± SEM) evoked by 50 µM Cd alone (A) or 10 µM kainate plus 50 µM Cd (B) as a fraction of current evoked by 10 µM kainate alone for A8 substitution with C, S, T, F, or Y. Asterisk denotes significant difference from S, T, F, or Y (ANOVA on ranks with post hoc Dunn’s test, 5–114 [A] or 3–17 [B] cells per construct). (C) After brief exposure to 100 µM MTSEA (blue bar) together with 10 µM kainate (open bars), the holding current and current evoked by 10 µM kainate were increased, whereas current evoked by 50 µM Cd alone (red bars) or with 10 µM kainate (cyan bars) was reduced. (D and E) Summary plots of current (mean ± SEM) evoked by Cd alone or with kainate, by kainate alone, and the holding current after MTSEA as a fraction of current before MTSEA for GluK2(Q) A8C (D; six cells) or L10C (E; six cells). Asterisk denotes significant difference from I post = I pre (t statistic, P < 0.01).
Figure 9.
Figure 9.
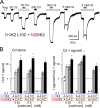
Cd activates heteromeric kainate receptors. (A) Whole-cell currents evoked by 10 µM kainate (open bars) and 500 or 50 µM Cd alone (red bars) or together with 10 µM kainate (mauve and cyan bars, respectively) in a cell cotransfected with GluK2(Q) L10C and GluK1(R). (B) Lack of inward rectification in current–voltage relations from the same cell shown in A supports formation of heteromeric receptors. (C) Summary plots of current (mean ± SEM) evoked by 50 µM Cd alone (left; 10–114 cells per construct) or 50 µM Cd plus 10 µM kainate (right; 9–17 cells) as a fraction of kainate alone in cells transfected with GluK2(Q) alone or cotransfected with GluK2(Q) A8C or L10C together with either GluK1(R) or GluK5. Note the log scale. Asterisk denotes significant difference from homomeric GluK2(Q) A8C or L10C.
Figure 10.
Figure 10.
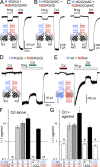
Cadmium activation of chimeric receptors with A8C substitutions. (A–C) Whole-cell currents evoked by 10 µM NMDA plus 10 µM glycine (open bars) or by 50 µM Cd alone (red bars) in HEK cells cotransfected with chimeric subunits bearing A8C substitutions on the N2B/K2(Q) subunit (A), on the N1/K2(Q) subunit (B), or on both chimeric subunits (C). (D and E) Chimeric receptors lacking cysteine substitution (D) and WT (N1 + N2B) NMDA receptors (E) were not activated by Cd alone, and coapplication of Cd (cyan bars) inhibited agonist-evoked current. (F and G) Summary plots of current evoked by Cd alone (F; 9–114 cells per construct) or together with agonists (G; 6–17 cells) as a fraction of the current evoked by agonists alone (mean ± SEM). The first four positions plot results for chimeric receptors. For comparison, GluK2(Q) WT and A8C results are replotted from Fig. 1 followed by WT GluN1 + GluN2B. Note the y-axis log scale. Asterisk denotes significantly greater effect of 50 µM Cd on receptors with A8C substitution to both chimeric subunits (one-way ANOVA with post hoc Student–Newman–Keuls test), # indicates significant inhibition of kainate-evoked current by Cd (t statistic), and ns indicates no significant increase in holding current by Cd alone (t statistic).
Figure 11.
Figure 11.
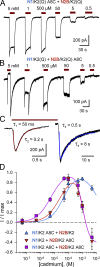
Concentration dependence of chimeric A8C mutant receptor activation. (A and B) Whole-cell currents evoked by Cd (5 and 1 mM and 500, 50, 5, and 0.5 µM) in cells transfected with N1/K2 A8C + N2B/K2 (A) or N1/K2 + N2B/K2 A8C (B). Chimeric receptors were both activated and blocked by the highest Cd doses tested, with stronger block observed for channels that included the N2B/K2 A8C subunit (B). (C) Currents from the onset and termination of 5 mM Cd exposure in B shown on an expanded time scale and fit with the sum of two exponentials (superimposed smooth curves). Exposure onset (red curve) includes time constants for activation (τ1 = 50 ms) and onset of block (τ2 = 0.2 s). On return to control solution (blue curve), receptors unblock (τ3 = 0.5 s) and deactivate (τ4 = 8 s). (D) Plot of steady-state current (mean ± SEM) during exposure to Cd as a fraction of the maximal Cd-evoked response, usually the peak tail current at termination of exposure to 5 mM Cd. Smooth curves are the best fit of (Materials and methods) I/Imax = m + ((1/(1 + (EC50/[Cd])n) − m)/(1 + ([Cd]/IC50)b)). For N1/K2A8C + N2B/K2 (blue triangles; 14 cells) the EC50 = 47 ± 8 µM, n = 1.0 ± 0.2, IC50 = 13 ± 10 mM, b = 0.9 ± 0.4, and the minimum parameter (m) was set to zero. Curves for N1/K2 + N2B/K2A8C (red inverted triangles; 14 cells) and N1/K2A8C + N2B/K2A8C (violet squares; 21 cells) show simultaneous fits constrained to have the same IC50 = 1.1 ± 0.2 mM, b = 1.8 ± 0.4, n = 0.9 ± 0.1, and m = −0.43 ± 0.12 with different EC50 values 27 ± 9 µM and 5.6 ± 1.7 µM, respectively. Individual fits requiring three additional free parameters were not significantly better (F test).
Figure 12.
Figure 12.
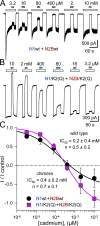
Cd inhibits chimeric and WT NMDA receptors. (A and B) Whole-cell currents evoked by 10 µM NMDA and 10 µM glycine (open bars) in HEK cells transfected with GluN1wt and GluN2Bwt cDNA (A) or with N1/K2(Q) and N2B/K2(Q) cDNA (B). Cd was coapplied at 3.2, 16, 80, or 400 µM or at 2 or 10 mM as indicated by the solid bars. (C) Current (mean ± SEM) recorded during Cd coapplication as a fraction of control current immediately before Cd exposure (six WT and eight chimera cells). Smooth curves are the best fit of I/Icontrol = m + (1 − m)/(1 + ([Cd]/IC50)n).
Figure 13.
Figure 13.
Cd activation of chimeric receptors with L10C substitutions. (A) Whole-cell currents activated by 10 µM NMDA plus 10 µM glycine (open bars) or 50 µM, 500 µM, or 5 mM Cd alone (red bars) or together with agonist (cyan bars). (B) Current (mean ± SEM) evoked by Cd alone (left; 5–15 cells per construct) or agonist plus Cd (right; 5–14 cells) as a fraction of current evoked by 10 µM NMDA plus 10 µM glycine. Note the y-axis log scale. Asterisk denotes significantly greater effect for receptors with L10C substitution to both chimeric subunits at each Cd dose (one-way ANOVA with post hoc Student–Newman–Keuls test), # indicates significant inhibition of kainate-evoked current by Cd (t statistic), and ns indicates no significant increase in holding current by Cd alone (t statistic).
Figure 14.
Figure 14.
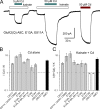
Potential coordination partners not required for Cd activation. (A) Whole-cell current 10 µM kainate (open bars), 50 µM Cd alone (red bar), and 5 or 50 µM Cd together with kainate (cyan bars) in an HEK cell transfected with triple mutant GluK2(Q) A8C, E13A (in the M3–S2 linker), and E811A (in the S2–M4 linker). (B and C) Summary plots of current (mean ± SEM) evoked by Cd alone (B; 4–114 cells per construct) or Cd plus kainate (C; 4–17 cells) as a fraction of the current evoked by kainate alone (note the y-axis log scale).
Figure 15.
Figure 15.
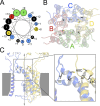
The M3 helix positions that support activation by Cd. (A) The M3 helical wheel from isoleucine (−1) to glutamate (+13). Circle diameters proportional to side chain volume. Colors denote side chain properties: negative charge (red), polar (blue), aromatic (green), hydrophobic (black), and cysteine substitution at positions 8 and 10 (yellow). (B) Semitransparent view down the open state model TMD axis illustrating A7, A8C, and L10 side chains. (C) The TMD side view of two GluK2 A8C open state homology model subunits in the C (blue) and D (yellow) conformations rotated 90° from B. The A7, A8C, and L10 side chains are shown as sticks. Vertical gray arrow denotes the central axis with the backbone cartoon semitransparent. A higher-resolution view of the boxed region is shown on the right.

Comment in

  • Prying open a glutamate receptor gate.
    Wollmuth LP. Wollmuth LP. J Gen Physiol. 2019 Apr 1;151(4):396-399. doi: 10.1085/jgp.201812312. Epub 2019 Feb 28. J Gen Physiol. 2019. PMID: 30819719 Free PMC article.

Similar articles

Cited by

References

    1. Akabas M.H. 2015. Cysteine modification: Probing channel structure, function and conformational change. Adv. Exp. Med. Biol. 869:25–54. 10.1007/978-1-4939-2845-3_3 - DOI - PubMed
    1. Alsaloum M., Kazi R., Gan Q., Amin J., and Wollmuth L.P.. 2016. A molecular determinant of subtype-specific desensitization in ionotropic glutamate receptors. J. Neurosci. 36:2617–2622. 10.1523/JNEUROSCI.2667-15.2016 - DOI - PMC - PubMed
    1. Bean B.P., Williams C.A., and Ceelen P.W.. 1990. ATP-activated channels in rat and bullfrog sensory neurons: Current-voltage relation and single-channel behavior. J. Neurosci. 10:11–19. 10.1523/JNEUROSCI.10-01-00011.1990 - DOI - PMC - PubMed
    1. Beck C., Wollmuth L.P., Seeburg P.H., Sakmann B., and Kuner T.. 1999. NMDAR channel segments forming the extracellular vestibule inferred from the accessibility of substituted cysteines. Neuron. 22:559–570. 10.1016/S0896-6273(00)80710-2 - DOI - PubMed
    1. Bhangoo S.K., and Swanson G.T.. 2013. Kainate receptor signaling in pain pathways. Mol. Pharmacol. 83:307–315. 10.1124/mol.112.081398 - DOI - PMC - PubMed

Publication types

Associated data