JNK2 modulates the CD1d-dependent and -independent activation of iNKT cells
- PMID: 30467836
- PMCID: PMC6452880
- DOI: 10.1002/eji.201847755
JNK2 modulates the CD1d-dependent and -independent activation of iNKT cells
Abstract
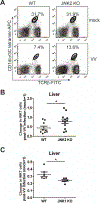
Invariant natural killer T (iNKT) cells play critical roles in autoimmune, anti-tumor, and anti-microbial immune responses, and are activated by glycolipids presented by the MHC class I-like molecule, CD1d. How the activation of signaling pathways impacts antigen (Ag)-dependent iNKT cell activation is not well-known. In the current study, we found that the MAPK JNK2 not only negatively regulates CD1d-mediated Ag presentation in APCs, but also contributes to CD1d-independent iNKT cell activation. A deficiency in the JNK2 (but not JNK1) isoform enhanced Ag presentation by CD1d. Using a vaccinia virus (VV) infection model known to cause a loss in iNKT cells in a CD1d-independent, but IL-12-dependent manner, we found the virus-induced loss of iNKT cells in JNK2 KO mice was substantially lower than that observed in JNK1 KO or wild-type (WT) mice. Importantly, compared to WT mice, JNK2 KO mouse iNKT cells were found to express less surface IL-12 receptors. As with a VV infection, an IL-12 injection also resulted in a smaller decrease in JNK2 KO iNKT cells as compared to WT mice. Overall, our work strongly suggests JNK2 is a negative regulator of CD1d-mediated Ag presentation and contributes to IL-12-induced iNKT cell activation and loss during viral infections.
Keywords: Antigen processing and presentation; CD1d; NKT cells; Signal transduction; Viral infection.
© 2018 WILEY-VCH Verlag GmbH & Co. KGaA, Weinheim.
Conflict of interest statement
Conflict of Interest Disclosure
The authors declare no commercial or financial conflict of interest.
Figures


Similar articles
-
Turned on by danger: activation of CD1d-restricted invariant natural killer T cells.Immunology. 2012 Sep;137(1):20-7. doi: 10.1111/j.1365-2567.2012.03612.x. Immunology. 2012. PMID: 22734667 Free PMC article. Review.
-
Antigen-dependent versus -independent activation of invariant NKT cells during infection.J Immunol. 2014 Jun 15;192(12):5490-8. doi: 10.4049/jimmunol.1400722. Epub 2014 May 9. J Immunol. 2014. PMID: 24813205 Free PMC article.
-
CD1d-independent activation of invariant natural killer T cells by staphylococcal enterotoxin B through major histocompatibility complex class II/T cell receptor interaction results in acute lung injury.Infect Immun. 2011 Aug;79(8):3141-8. doi: 10.1128/IAI.00177-11. Epub 2011 May 31. Infect Immun. 2011. PMID: 21628519 Free PMC article.
-
CD1d-independent activation of mouse and human iNKT cells by bacterial superantigens.Immunol Cell Biol. 2012 Aug;90(7):699-709. doi: 10.1038/icb.2011.90. Epub 2011 Nov 1. Immunol Cell Biol. 2012. PMID: 22041925
-
Functions of CD1d-Restricted Invariant Natural Killer T Cells in Antimicrobial Immunity and Potential Applications for Infection Control.Front Immunol. 2018 Jun 6;9:1266. doi: 10.3389/fimmu.2018.01266. eCollection 2018. Front Immunol. 2018. PMID: 29928278 Free PMC article. Review.
Cited by
-
High Frequency of Gamma Interferon-Producing PLZFloRORγtlo Invariant Natural Killer 1 Cells Infiltrating Herpes Simplex Virus 1-Infected Corneas Is Associated with Asymptomatic Ocular Herpesvirus Infection.J Virol. 2020 Apr 16;94(9):e00140-20. doi: 10.1128/JVI.00140-20. Print 2020 Apr 16. J Virol. 2020. PMID: 32102882 Free PMC article.
-
The immune system in neurological diseases: What innate-like T cells have to say.J Allergy Clin Immunol. 2024 Apr;153(4):913-923. doi: 10.1016/j.jaci.2024.02.003. Epub 2024 Feb 15. J Allergy Clin Immunol. 2024. PMID: 38365015 Review.
-
Role of NKT Cells during Viral Infection and the Development of NKT Cell-Based Nanovaccines.Vaccines (Basel). 2021 Aug 26;9(9):949. doi: 10.3390/vaccines9090949. Vaccines (Basel). 2021. PMID: 34579186 Free PMC article. Review.
-
Protective effects of Ganoderma lucidum spores on estradiol benzoate-induced TEC apoptosis and compromised double-positive thymocyte development.Front Pharmacol. 2024 Aug 16;15:1419881. doi: 10.3389/fphar.2024.1419881. eCollection 2024. Front Pharmacol. 2024. PMID: 39221140 Free PMC article.
-
Poxviruses and the immune system: Implications for monkeypox virus.Int Immunopharmacol. 2022 Dec;113(Pt A):109364. doi: 10.1016/j.intimp.2022.109364. Epub 2022 Oct 22. Int Immunopharmacol. 2022. PMID: 36283221 Free PMC article. Review.
References
-
- Brutkiewicz RR, Lin Y, Cho S, Hwang YK, Sriram V and Roberts TJ, CD1d-mediated antigen presentation to natural killer T (NKT) cells. Crit Rev Immunol 2003. 23: 403–419. - PubMed
-
- Brutkiewicz RR, CD1d ligands: the good, the bad, and the ugly. J Immunol 2006. 177: 769–775. - PubMed
-
- Brigl M and Brenner MB, How invariant natural killer T cells respond to infection by recognizing microbial or endogenous lipid antigens. Semin Immunol 2010. 22: 79–86. - PubMed
-
- Salio M, Silk JD and Cerundolo V, Recent advances in processing and presentation of CD1 bound lipid antigens. Curr Opin Immunol 2010. 22: 81–88. - PubMed
Publication types
MeSH terms
Substances
Grants and funding
LinkOut - more resources
Full Text Sources
Molecular Biology Databases
Research Materials
Miscellaneous

