

Analysis of regulator of G-protein signalling 2 (RGS2) expression and function during prostate cancer progression
- PMID: 30467386
- PMCID: PMC6250724
- DOI: 10.1038/s41598-018-35332-4
Analysis of regulator of G-protein signalling 2 (RGS2) expression and function during prostate cancer progression
Abstract
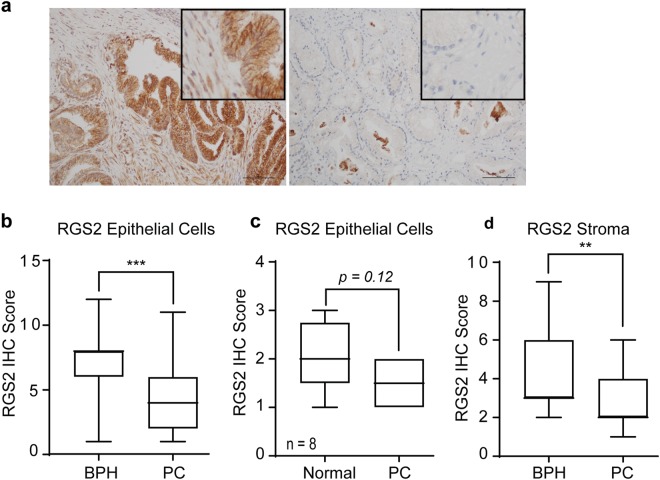
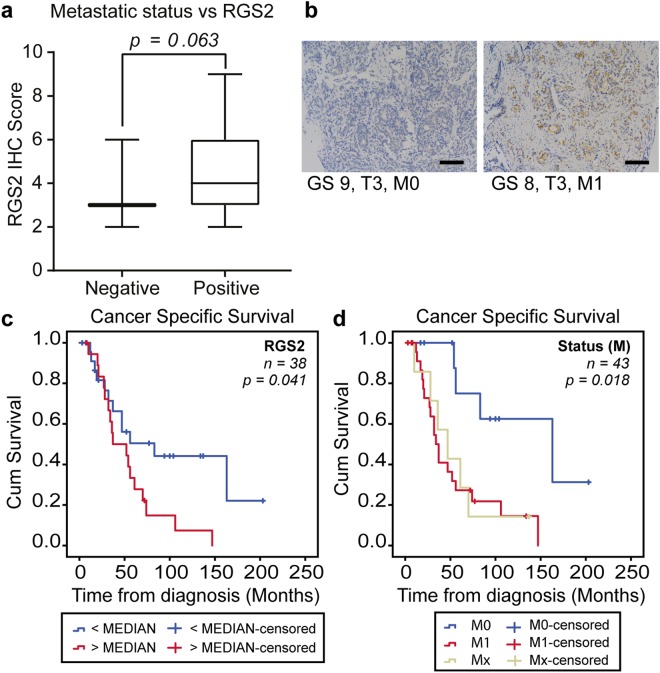
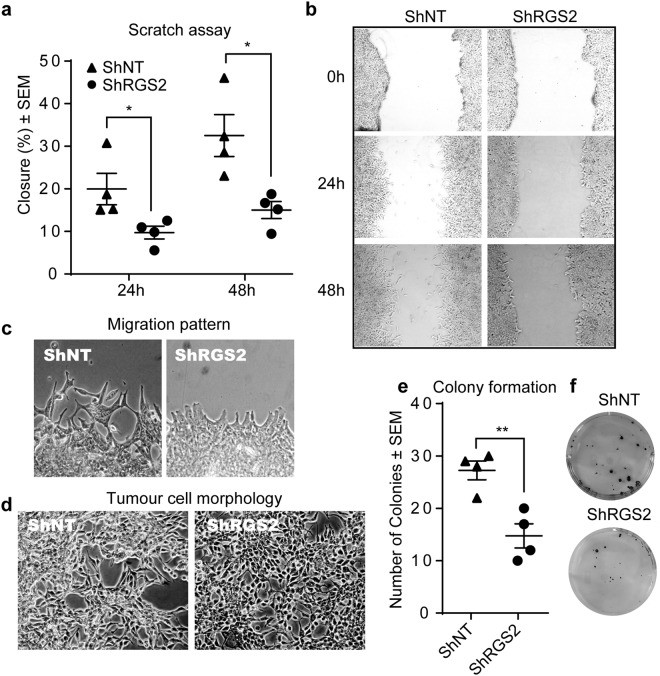
Prostate cancer (PC) represents the second highest cancer-related mortality among men and the call for biomarkers for early discrimination between aggressive and indolent forms is essential. Downregulation of Regulator of G-protein signaling 2 (RGS2) has been shown in PC, however the underlying mechanism has not been described. Aberrant RGS2 expression has also been reported for other carcinomas in association to both positive and negative prognosis. In this study, we assessed RGS2 expression during PC progression in terms of regulation and impact on tumour phenotype and evaluated its prognostic value. Our experimental data suggest that the RGS2 downregulation seen in early PC is caused by hypoxia. In line with the common indolent phenotype of a primary PC, knockdown of RGS2 induced epithelial features and impaired metastatic properties. However, increased STAT3, TWIST1 and decreased E-cadherin expression suggest priming for EMT. Additionally, improved tumour cell survival and increased BCL-2 expression linked decreased RGS2 levels to fundamental tumour advantages. In contrast, high RGS2 levels in advanced PC were correlated to poor patient survival and a positive metastatic status. This study describes novel roles for RGS2 during PC progression and suggests a prognostic potential discriminating between indolent and metastatic forms of PC.
Conflict of interest statement
The authors declare no competing interests.
Figures


Similar articles
-
RGS2 is prognostic for development of castration resistance and cancer-specific survival in castration-resistant prostate cancer.Prostate. 2020 Aug;80(11):799-810. doi: 10.1002/pros.23994. Epub 2020 May 25. Prostate. 2020. PMID: 32449815
-
Analysis of RGS2 expression and prognostic significance in stage II and III colorectal cancer.Biosci Rep. 2010 Dec;30(6):383-90. doi: 10.1042/BSR20090129. Biosci Rep. 2010. PMID: 20001967
-
Regulator of G-protein signaling 2 (RGS2) inhibits androgen-independent activation of androgen receptor in prostate cancer cells.Oncogene. 2006 Jun 22;25(26):3719-34. doi: 10.1038/sj.onc.1209408. Epub 2006 Jan 30. Oncogene. 2006. PMID: 16449965
-
Clinical variability and molecular heterogeneity in prostate cancer.Asian J Androl. 2016 Jul-Aug;18(4):543-8. doi: 10.4103/1008-682X.178852. Asian J Androl. 2016. PMID: 27080479 Free PMC article. Review.
-
The metastatic phenotype--prognostic implications.Crit Rev Oncol Hematol. 1996 Oct;24(2):71-96. doi: 10.1016/1040-8428(96)00213-2. Crit Rev Oncol Hematol. 1996. PMID: 8889367 Review.
Cited by
-
Predicting response to enzalutamide and abiraterone in metastatic prostate cancer using whole-omics machine learning.Nat Commun. 2023 Apr 8;14(1):1968. doi: 10.1038/s41467-023-37647-x. Nat Commun. 2023. PMID: 37031196 Free PMC article.
-
Low Expression of RGS2 Promotes Poor Prognosis in High-Grade Serous Ovarian Cancer.Cancers (Basel). 2022 Sep 23;14(19):4620. doi: 10.3390/cancers14194620. Cancers (Basel). 2022. PMID: 36230542 Free PMC article.
-
A common allele increases endometrial Wnt4 expression, with antagonistic implications for pregnancy, reproductive cancers, and endometriosis.Nat Commun. 2024 Feb 12;15(1):1152. doi: 10.1038/s41467-024-45338-4. Nat Commun. 2024. PMID: 38346980 Free PMC article.
-
Gene Expression Alterations during Development of Castration-Resistant Prostate Cancer Are Detected in Circulating Tumor Cells.Cancers (Basel). 2019 Dec 21;12(1):39. doi: 10.3390/cancers12010039. Cancers (Basel). 2019. PMID: 31877738 Free PMC article.
-
MicroRNA-3935 promotes human trophoblast cell epithelial-mesenchymal transition through tumor necrosis factor receptor-associated factor 6/regulator of G protein signaling 2 axis.Reprod Biol Endocrinol. 2021 Sep 7;19(1):134. doi: 10.1186/s12958-021-00817-x. Reprod Biol Endocrinol. 2021. PMID: 34493304 Free PMC article.
References
Publication types
MeSH terms
Substances
Grants and funding
- FB 12-59/Stiftelsen Assar Gabrielssons Fond (Assar Gabrielssons Foundation)/International
- FB 13-48/Stiftelsen Assar Gabrielssons Fond (Assar Gabrielssons Foundation)/International
- vet1-150/2012/Stiftelserna Wilhelm och Martina Lundgrens (Wilhelm and Martina Lundgren Foundation)/International
- CAN 2017/380/Cancerfonden (Swedish Cancer Society)/International
LinkOut - more resources
Full Text Sources
Medical
Molecular Biology Databases
Miscellaneous
