

The IκB kinase complex is a regulator of mRNA stability
- PMID: 30467221
- PMCID: PMC6293339
- DOI: 10.15252/embj.201798658
The IκB kinase complex is a regulator of mRNA stability
Abstract
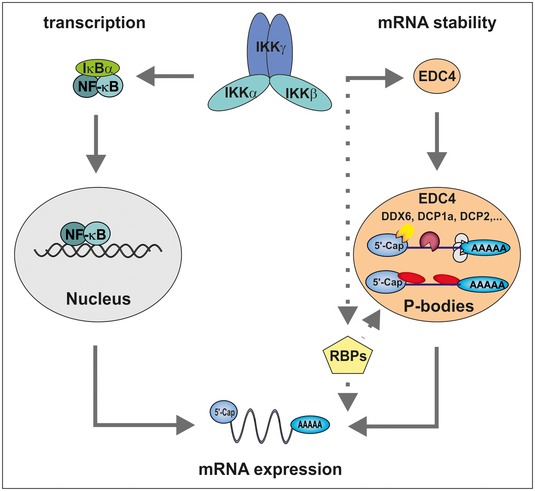
The IκB kinase (IKK) is considered to control gene expression primarily through activation of the transcription factor NF-κB. However, we show here that IKK additionally regulates gene expression on post-transcriptional level. IKK interacted with several mRNA-binding proteins, including a Processing (P) body scaffold protein, termed enhancer of decapping 4 (EDC4). IKK bound to and phosphorylated EDC4 in a stimulus-sensitive manner, leading to co-recruitment of P body components, mRNA decapping proteins 1a and 2 (DCP1a and DCP2) and to an increase in P body numbers. Using RNA sequencing, we identified scores of transcripts whose stability was regulated via the IKK-EDC4 axis. Strikingly, in the absence of stimulus, IKK-EDC4 promoted destabilization of pro-inflammatory cytokines and regulators of apoptosis. Our findings expand the reach of IKK beyond its canonical role as a regulator of transcription.
Keywords: IKK; EDC4; P bodies; RNA stability; post‐transcriptional regulation.
© 2018 The Authors.
Figures
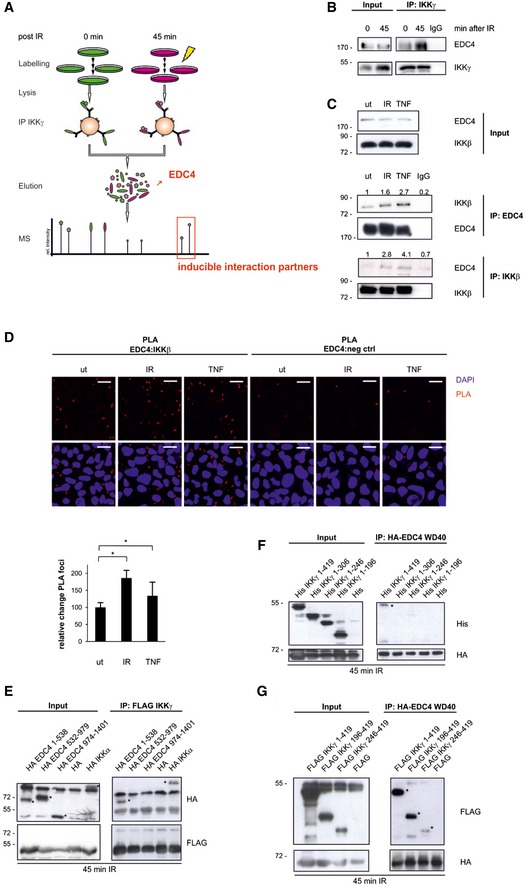
Schematic diagram of the SILAC screen.
Immunoprecipitation of endogenous IKKγ from cytoplasmic cell lysates of unstimulated (ut) or irradiated U2‐OS cells followed by Western blot (WB) of IKKγ and EDC4.
Immunoprecipitation of endogenous EDC4 or IKKβ from unstimulated (ut), irradiated (20 Gy; 45 min post‐stimulus) or TNFα‐treated (10 ng/ml; 15 min) U2‐OS cells, WB of EDC4 or IKKβ. Fold changes of co‐precipitated proteins are indicated. Results are representative for three experiments.
Proximity ligation assay (PLA) of unstimulated (ut), irradiated (20 Gy: 45 min post‐stimulus) or TNFα‐treated (10 ng/ml; 45 min post‐stimulus) U2‐OS cells; IKKβ‐EDC4 interaction (red), nucleus (blue). As a negative control, PLA was performed without primary IKKβ antibody. Scale bar: 25 μm. Bottom panel: relative quantitation of independent experiments (n = 2) by ImageJ software, at least 500 cells per experiment ± s.d. unpaired t‐test, *P < 0.05.
Co‐expression of full‐length FLAG‐IKKγ with HA‐tagged EDC4 sub‐regions, wild‐type HA‐IKKα (positive control) or empty vector (negative control) in HEK293 cells, followed by immunoprecipitation of FLAG‐IKKγ and WB of FLAG and HA. Immunoprecipitation was performed with anti‐FLAG sepharose from whole‐cell lysates of irradiated (10 Gy) cells. Left panel: input, right panel: FLAG‐IP. Asterisks denote specific bands. Note that the three EDC4 fragments reveal an aberrant migration relative to calculated molecular weight in SDS–PAGE (Braun et al, 2012).
HEK293 cells expressing N‐terminally His‐tagged IKKγ deletion constructs (as shown in Appendix Fig S1H) or empty His‐vector together with HA‐tagged EDC4 WD40 domain (HA‐EDC41–538). Immunoprecipitates from whole‐cell lysates of irradiated cells with anti‐HA sepharose were analysed by WB for His and HA. Left panel, input; right panel, HA‐IP. Asterisks, specific bands.
Co‐immunoprecipitation as in (F) with C‐terminally FLAG‐tagged IKKγ.
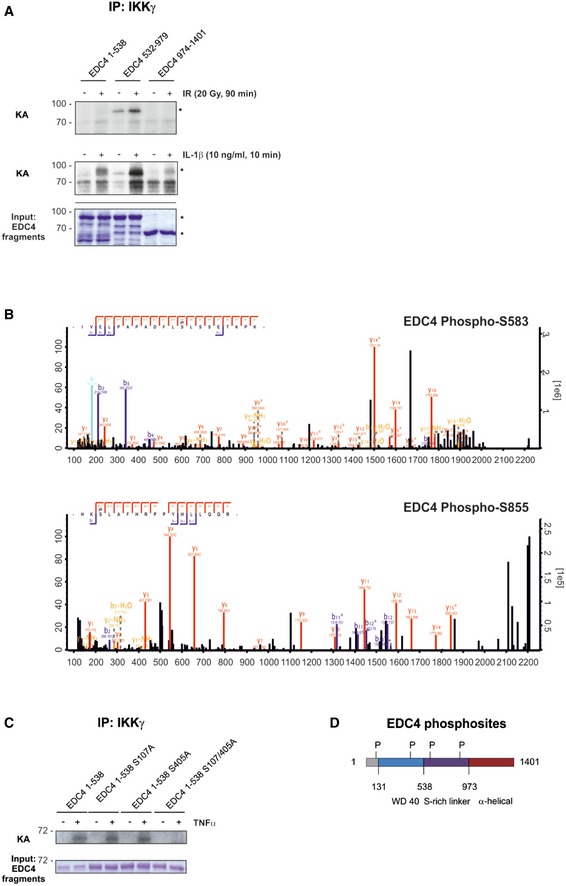
In vitro kinase assay (KA) using endogenous IKKβ from cells, unstimulated or stimulated with IR (20 Gy, 45 min; top panel) or IL‐1β (10 ng/ml, 10 min; bottom panel) with purified GST‐EDC4 domains as indicated. Lower panel: cold KA as above, Coomassie blue staining. Asterisks denote specific bands.
IKK phosphosite identification in EDC4 by mass spectrometry (see Table EV2 for MS data). Endogenous IKK purified from unstimulated or TNFα‐treated (10 ng/ml, 15 min) U2‐OS cells by immunoprecipitation of IKKγ was used in a cold KA with recombinant EDC4 sub‐regions, followed by MS analysis. Top, MS spectrum for phospho‐serine 583. Bottom, MS spectrum for phospho‐serine 855.
In vitro KA of IKKβ (as in A) from TNFα‐stimulated cells with purified recombinant Strep‐EDC4 WD40 domain (EDC4 1–538) and point mutants for IKK phosphosites, S107A, S405A and S107/405A. Below: cold kinase assay.
Diagram of EDC4 indicating IKKβ‐phosphorylated serines.
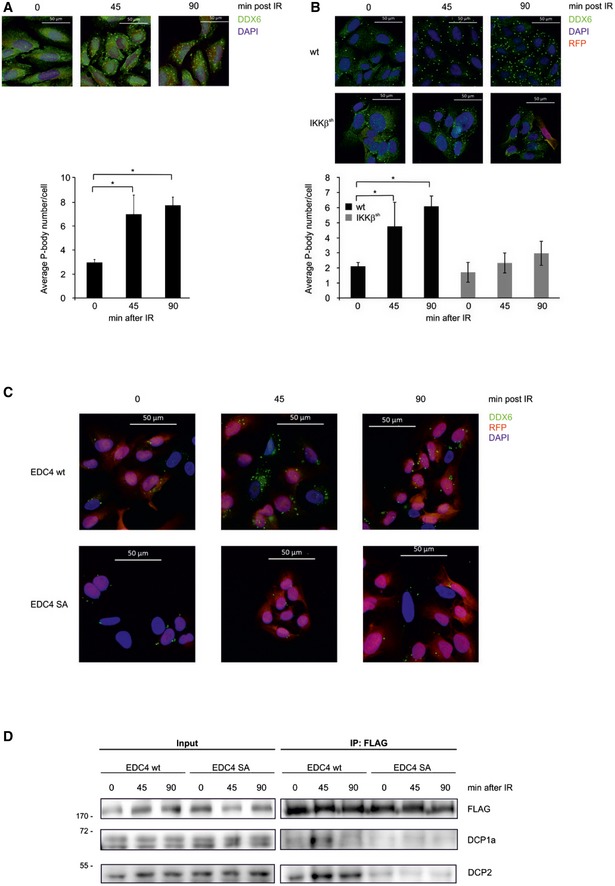
Fluorescence microscopy using anti‐DDX6 antibody (green) of untreated U2‐OS cells, or 45 or 90 min post‐irradiation (IR). Nuclei stained with DAPI (blue), scale bar 50 μm. Bottom panel: quantification of P‐body foci from independent experiments (n = 3) by ImageJ software, 100 cells per experiment ± s.d. unpaired t‐test, *P < 0.01. Equivalent results were obtained with staining for P body components EDC4, DCP1a and DCP2 (not shown).
As described in panel (A), except in clonal U2‐OS cells stably expressing pTRIPZ RFP‐coupled shIKKβ. Cells were treated with doxycycline (IKKβsh) or left untreated (wt) and analysed 45 or 90 min after IR. Bottom panel: P body quantification as in (A).
Fluorescence microscopy using EGFP‐tagged EDC4 (green) and DAPI in clonal U2‐OS cells stably expressing pTRIPZ RFP‐coupled shEDC4 and reconstituted with either wild‐type EGFP‐tagged EDC4 or EGFP‐tagged EDC4 phospho‐deficient Ser107/405/583/855Ala mutant (SA). Cells were pre‐treated with doxycycline to deplete endogenous EDC4 prior to IR.
Immunoprecipitation of clonal U2‐OS cells stably expressing pTRIPZ RFP‐coupled shEDC4 to deplete endogenous EDC4 and reconstituted with either shRNA‐resistant wild‐type FLAG‐tagged EDC4 or FLAG‐tagged EDC4 phospho‐deficient mutant (SA). Endogenous EDC4 was depleted with doxycycline treatment prior to IR and co‐immunoprecipitation with anti‐FLAG sepharose. IP lysates were analysed by Western blot with anti‐FLAG, anti‐DCP1a and anti‐DCP2 antibodies. Left: input. Right: FLAG‐IP.
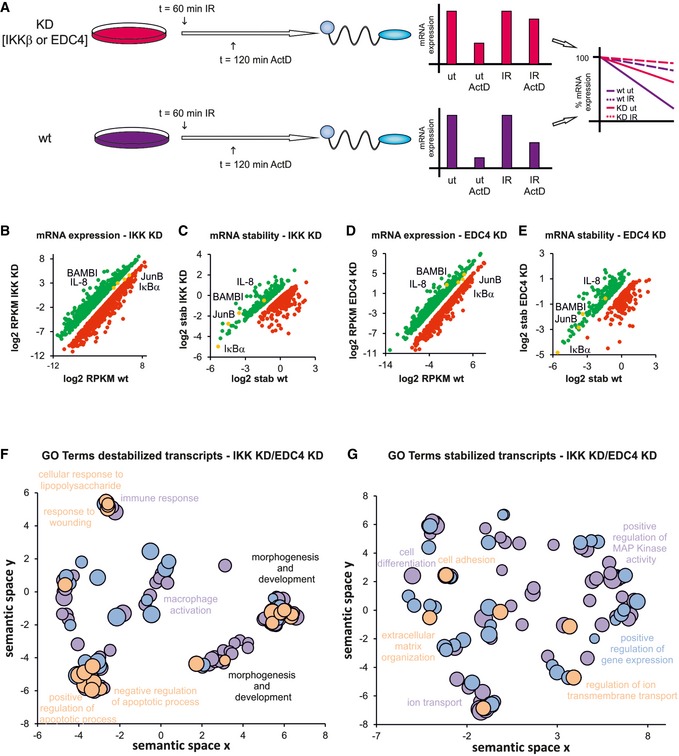
Schematic diagram of ActD chase experiments to determine stability of transcripts. pTRIPZ constructs encoding shIKKβ or shEDC4 (as above) were treated with dox to induce knockdown (KD, IKKβsh, EDC4sh) or left untreated (wt). ActD treatment, 120 min, IR at 60 min prior to harvest. RNA was analysed by qRT–PCR. Bar charts represent raw data. Line graphs represent normalized stability, were IR or unstimulated samples were set at 100% and ActD‐treated samples represent residual expression.
Graph showing mRNAs with increased (green) or decreased (red) expression in IKK‐depleted cells (see A) relative to wt. mRNA expression was measured by RNA‐Seq, and significance was calculated for two corresponding conditions and cut‐off set for P‐value < 0.1 and fold change > 2 (Table EV4A)
Graph illustrating mRNAs with increased (green) or decreased (red) stability in IKK‐depleted cells (see A) relative to wt. mRNA stability was determined by RNA‐Seq (Table EV4B).
Analysis of mRNA expression in EDC4‐depleted cells relative to wt as in (A; Table EV4C).
Analysis of mRNA stability in EDC4‐depleted cells relative to wt as in (B; Table EV4D).
GO terms of transcripts which are destabilized by IKK or EDC4 using REVIGO for removal of redundancy of GO terms (Supek et al, 2011). Scatterplot clustering of groups with functionally similar GO terms. Each circle represents a GO term; size indicative of gene target numbers; the x‐axis and y‐axis are semantic coordinates given by REVIGO; violet: EDC4‐depleted, blue: IKK‐depleted, orange: terms identical for both EDC4 and IKK‐depleted samples; P‐value < 0.05 (Table EV4E). Note that semantic co‐positioning in the plot indicates functional similarity of GO terms.
Visualization of GO terms of mRNAs that are stabilized by IKK or EDC4, as in (F; Table EV4F).
Comment in
-
More than just an IκB kinase: the IKK complex coordinates mRNA stability and transcription.EMBO J. 2018 Dec 14;37(24):e101084. doi: 10.15252/embj.2018101084. Epub 2018 Dec 3. EMBO J. 2018. PMID: 30509970 Free PMC article.
Similar articles
-
c-Jun N-terminal kinase phosphorylates DCP1a to control formation of P bodies.J Cell Biol. 2011 Aug 22;194(4):581-96. doi: 10.1083/jcb.201006089. J Cell Biol. 2011. PMID: 21859862 Free PMC article.
-
K63-Ubiquitylation and TRAF6 Pathways Regulate Mammalian P-Body Formation and mRNA Decapping.Mol Cell. 2016 Jun 16;62(6):943-957. doi: 10.1016/j.molcel.2016.05.017. Mol Cell. 2016. PMID: 27315556
-
A non-canonical role for the EDC4 decapping factor in regulating MARF1-mediated mRNA decay.Elife. 2020 Jun 8;9:e54995. doi: 10.7554/eLife.54995. Elife. 2020. PMID: 32510323 Free PMC article.
-
Regulation of cyclin D1 gene expression.Biochem Soc Trans. 2010 Feb;38(Pt 1):217-22. doi: 10.1042/BST0380217. Biochem Soc Trans. 2010. PMID: 20074063 Review.
-
Regulation and function of IKK and IKK-related kinases.Sci STKE. 2006 Oct 17;2006(357):re13. doi: 10.1126/stke.3572006re13. Sci STKE. 2006. PMID: 17047224 Review.
Cited by
-
Post-Transcriptional Control of mRNA Metabolism and Protein Secretion: The Third Level of Regulation within the NF-κB System.Biomedicines. 2022 Aug 29;10(9):2108. doi: 10.3390/biomedicines10092108. Biomedicines. 2022. PMID: 36140209 Free PMC article. Review.
-
Epigenetics and Inflammation in Diabetic Nephropathy.Front Physiol. 2021 May 5;12:649587. doi: 10.3389/fphys.2021.649587. eCollection 2021. Front Physiol. 2021. PMID: 34025445 Free PMC article. Review.
-
Spatiotemporal control of kinases and the biomolecular tools to trace activity.J Biol Chem. 2024 Nov;300(11):107846. doi: 10.1016/j.jbc.2024.107846. Epub 2024 Oct 1. J Biol Chem. 2024. PMID: 39362469 Free PMC article. Review.
-
Regulation of Transcription Factor NF-κB in Its Natural Habitat: The Nucleus.Cells. 2021 Mar 29;10(4):753. doi: 10.3390/cells10040753. Cells. 2021. PMID: 33805563 Free PMC article. Review.
-
Single-Cell Analysis of Multiple Steps of Dynamic NF-κB Regulation in Interleukin-1α-Triggered Tumor Cells Using Proximity Ligation Assays.Cancers (Basel). 2019 Aug 16;11(8):1199. doi: 10.3390/cancers11081199. Cancers (Basel). 2019. PMID: 31426445 Free PMC article.
References
-
- Bhattacharyya SN, Habermacher R, Martine U, Closs EI, Filipowicz W (2006) Stress‐induced reversal of microRNA repression and mRNA P‐body localization in human cells. Cold Spring Harb Symp Quant Biol 71: 513–521 - PubMed
Publication types
MeSH terms
Substances
LinkOut - more resources
Full Text Sources
Other Literature Sources
Molecular Biology Databases
