A split luciferase-based probe for quantitative proximal determination of Gαq signalling in live cells
- PMID: 30464299
- PMCID: PMC6249299
- DOI: 10.1038/s41598-018-35615-w
A split luciferase-based probe for quantitative proximal determination of Gαq signalling in live cells
Abstract
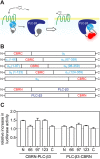
The earlier an activation of a G protein-dependent signalling cascade at a G protein-coupled receptor (GPCR) is probed, the less amplificatory effects contribute to the measured signal. This is especially useful in case of a precise quantification of agonist efficacies, and is of paramount importance, when determining agonist bias in relation to the β-arrestin pathway. As most canonical assays with medium to high throughput rely on the quantification of second messengers, and assays affording more proximal readouts are often limited in throughput, we developed a technique with a proximal readout and sufficiently high throughput that can be used in live cells. Split luciferase complementation (SLC) was applied to assess the interaction of Gαq with its effector phospholipase C-β3. The resulting probe yielded an excellent Z' value of 0.7 and offers a broad and easy applicability to various Gαq-coupling GPCRs (hH1R, hM1,3,5R, hNTS1R), expressed in HEK293T cells, allowing the functional characterisation of agonists and antagonists. Furthermore, the developed sensor enabled imaging of live cells by luminescence microscopy, as demonstrated for the hM3R. The versatile SLC-based probe is broadly applicable e.g. to the screening and the pharmacological characterisation of GPCR ligands as well as to molecular imaging.
Conflict of interest statement
The authors declare no competing interests.
Figures


Similar articles
-
Quantitative Determination and Imaging of Gαq Signaling in Live Cells via Split-Luciferase Complementation.Methods Mol Biol. 2021;2274:69-78. doi: 10.1007/978-1-0716-1258-3_7. Methods Mol Biol. 2021. PMID: 34050463
-
Split luciferase-based assay for simultaneous analyses of the ligand concentration- and time-dependent recruitment of β-arrestin2.Anal Biochem. 2019 May 15;573:8-16. doi: 10.1016/j.ab.2019.02.023. Epub 2019 Mar 8. Anal Biochem. 2019. PMID: 30853375
-
WDR36 acts as a scaffold protein tethering a G-protein-coupled receptor, Gαq and phospholipase Cβ in a signalling complex.J Cell Sci. 2011 Oct 1;124(Pt 19):3292-304. doi: 10.1242/jcs.085795. J Cell Sci. 2011. PMID: 21940795
-
Gαq signalling: the new and the old.Cell Signal. 2014 May;26(5):833-48. doi: 10.1016/j.cellsig.2014.01.010. Epub 2014 Jan 17. Cell Signal. 2014. PMID: 24440667 Review.
-
Decoding Gαq signaling.Life Sci. 2016 May 1;152:99-106. doi: 10.1016/j.lfs.2016.03.037. Epub 2016 Mar 22. Life Sci. 2016. PMID: 27012764 Review.
Cited by
-
A Rationally Designed c-di-AMP Förster Resonance Energy Transfer Biosensor To Monitor Nucleotide Dynamics.J Bacteriol. 2021 Sep 8;203(19):e0008021. doi: 10.1128/JB.00080-21. Epub 2021 Sep 8. J Bacteriol. 2021. PMID: 34309402 Free PMC article.
-
The Role of Orthosteric Building Blocks of Bitopic Ligands for Muscarinic M1 Receptors.ACS Omega. 2020 Dec 1;5(49):31706-31715. doi: 10.1021/acsomega.0c04220. eCollection 2020 Dec 15. ACS Omega. 2020. PMID: 33344823 Free PMC article.
-
A STING-based biosensor affords broad cyclic dinucleotide detection within single living eukaryotic cells.Nat Commun. 2020 Jul 15;11(1):3533. doi: 10.1038/s41467-020-17228-y. Nat Commun. 2020. PMID: 32669552 Free PMC article.
-
Structure of the human galanin receptor 2 bound to galanin and Gq reveals the basis of ligand specificity and how binding affects the G-protein interface.PLoS Biol. 2022 Aug 1;20(8):e3001714. doi: 10.1371/journal.pbio.3001714. eCollection 2022 Aug. PLoS Biol. 2022. PMID: 35913979 Free PMC article.
-
BRET-Based Biosensors to Measure Agonist Efficacies in Histamine H1 Receptor-Mediated G Protein Activation, Signaling and Interactions with GRKs and β-Arrestins.Int J Mol Sci. 2022 Mar 16;23(6):3184. doi: 10.3390/ijms23063184. Int J Mol Sci. 2022. PMID: 35328605 Free PMC article.
References
Publication types
MeSH terms
Substances
Grants and funding
- GRK1910/Deutsche Forschungsgemeinschaft (German Research Foundation)/International
- GRK1910/Deutsche Forschungsgemeinschaft (German Research Foundation)/International
- GRK1910/Deutsche Forschungsgemeinschaft (German Research Foundation)/International
- 26220805/Japan Society for the Promotion of Science (JSPS)/International
LinkOut - more resources
Full Text Sources
Research Materials

