. 2019 Sep;26(9):1716-1734.
doi: 10.1038/s41418-018-0241-1. Epub 2018 Nov 21.

BICD1 mediates HIF1α nuclear translocation in mesenchymal stem cells during hypoxia adaptation

Affiliations

BICD1 mediates HIF1α nuclear translocation in mesenchymal stem cells during hypoxia adaptation

Hyun Jik Lee et al. Cell Death Differ. 2019 Sep.

Abstract

Hypoxia inducible factor 1α (HIF1α) is a master regulator leading to metabolic adaptation, an essential physiological process to maintain the survival of stem cells under hypoxia. However, it is poorly understood how HIF1α translocates into the nucleus in stem cells under hypoxia. Here, we investigated the role of a motor adaptor protein Bicaudal D homolog 1 (BICD1) in dynein-mediated HIF1α nuclear translocation and the effect of BICD1 regulation on hypoxia adaptation and its therapeutic potential on human umbilical cord blood-derived mesenchymal stem cells (UCB-MSCs). In our results, silencing of BICD1 but not BICD2 abolished HIF1α nuclear translocation and its activity. BICD1 overexpression further enhanced hypoxia-induced HIF1α nuclear translocation. Hypoxia stimulated direct bindings of HIF1α to BICD1 and the intermediate chain of dynein (Dynein IC), which was abolished by BICD1 silencing. Akt inhibition reduced the binding of BICD1 to HIF1α and nuclear translocation of HIF1α. Conversely, Akt activation or GSK3β silencing further enhanced the hypoxia-induced HIF1α nuclear translocation. Furthermore, BICD1 silencing abolished hypoxia-induced glycolytic reprogramming and increased mitochondrial ROS accumulation and apoptosis in UCB-MSCs under hypoxia. In the mouse skin wound healing model, the transplanted cell survival and skin wound healing capacities of hypoxia-pretreated UCB-MSCs were reduced by BICD1 silencing and further increased by GSK3β silencing. In conclusion, we demonstrated that BICD1-induced HIF1α nuclear translocation is critical for hypoxia adaptation, which determines the regenerative potential of UCB-MSCs.


Conflict of interest statement

The authors declare that they have no conflict of interest.

Figures
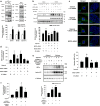
Fig. 1
Fig. 1
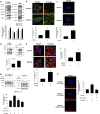
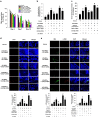
Role of BICD1 in dynein-mediated HIF1α nuclear translocation in UCB-MSCs. a Co-immunoprecipitation of BICD1, BICD2, Dynein IC, and α-Tubulin with IgG and HIF1α antibodies were shown in left panel. Total protein expressions in lysate were shown in right panel. n = 3. *p < 0.05 vs. normoxia control. b–d Cells were transfected with BICD1, BICD2 or NT siRNA prior to hypoxia incubation for 24 h. b HIF1α, Lamin A/C, and α-Tubulin in cytosolic and nuclear fractionized samples were detected by western blot. n = 3. c Cells were immunostained with HIF1α-specific antibody. Scale bars are 8 μm (Magnification, × 1,000). n = 5. d HIF1 activity was measured by dual luciferase reporter assay. n = 6. *p < 0.05 vs. normoxia control with NT siRNA transfection, #p < 0.05 vs. hypoxia with NT siRNA transfection. e, f Cells were transfected with plasmid vector for 24 h prior to hypoxia treatment for 24 h. e HIF1α, Lamin A/C, and α-Tubulin in cytosolic and nuclear fractionized samples were detected by western blot. n = 3. f HIF1 activity was measured by dual luciferase reporter assay. n = 7. HIF1α expression in nuclear fractionized samples was normalized by Lamin A/C. Quantitative data are presented as a mean ± S.E.M. All blot and immunofluorescence images are representative. *p < 0.05 vs. normoxia control with pcDNA3.1/cEGFP vector transfection, #p < 0.05 vs. hypoxia with pcDNA3.1/cEGFP vector transfection
Fig. 2
Fig. 2
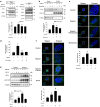
Effect of hypoxia on the interaction between HIF1α and BICD1. a Co-immunoprecipitation of HIF1α, Dynein IC, Importin α3, RanBP2 with IgG and BICD1 antibodies were shown in left panel. Total protein expressions in lysate were shown in right panel. n = 3. b Cells were immunostained with HIF1α and BICD1-specific antibodies. Scale bars are 8 μm (Magnification, × 1,000). White arrow heads indicate co-localization of HIF1α with BICD1. c Interaction between HIF1α and BICD1 (HIF1α/BICD1, red) was analyzed by PLA. Scale bars are 8 μm (Magnification, × 1,000). n = 6. *p < 0.05 vs. normoxia control. d–f Cells were pretreated with MG132 (1 μM) for 30 min prior to hypoxia treatment for 24 h. d Co-immunoprecipitation of HIF1α with IgG and BICD1 were shown in left panel. Total protein expressions in lysate were shown in right panel. n = 3. e Cells were immunostained with HIF1α and BICD1-specific antibodies. White arrow heads indicate co-localization of HIF1α with BICD1 in MG132-pretreated UCB-MSCs. Scale bars are 8 μm (Magnification, × 1,000). n = 5. f HIF1 activity was measured by dual luciferase reporter assay. n = 6. *p < 0.05 vs. normoxia control with MG132 pretreatment. g, h Cells were transfected with BICD1 or NT siRNA for 24 h prior to hypoxia treatment for 24 h. g Co-immunoprecipitation of Dynein IC with IgG and HIF1α antibodies were shown in left panel. Total protein expressions in lysate were shown in right panel. n = 3. h Interaction between HIF1α and Dynein IC (HIF1α/Dynein IC, red) was analyzed by PLA. Scale bars are 8 μm (Magnification, × 1,000). Quantitative data are presented as a mean ± S.E.M. All blots and immunofluorescence images are representative. *p < 0.05 vs. normoxia control with NT siRNA transfection, #p < 0.05 vs. hypoxia with NT siRNA transfection
Fig. 3
Fig. 3
Role of hypoxia-activated Akt in BICD1-mediated HIF1α nuclear translocation. a–c The UCB-MSCs were pretreated with wortmannin (1 μM) for 30 min prior to hypoxia treatment for 24 h. a Co-immunoprecipitation of HIF1α and α-Tubulin with IgG and BICD1 antibodies were shown in left panel. Total protein expressions in lysate were shown in right panel. n = 3. b HIF1α, Lamin A/C, and α-Tubulin in cytosolic and nuclear fractionized samples were detected by western blot. n = 3. c Cells were immunostained with HIF1α-specific antibodies. Scale bars are 8 μm (Magnification, × 1,000). n = 4. d–f Cells were pretreated with Akt inhibitor (2 μM) or SC-79 (5 μg/mL) for 30 min prior to hypoxia treatment for 24 h. d HIF1 activities of UCB-MSCs were measured by dual luciferase reporter assay. n = 8. e HIF1α, Lamin A/C, and α-Tubulin protein levels in cytosolic and nuclear fractionized samples were analyzed by western blot. n = 3. f Cells were immunostained with HIF1α-specific antibody. Scale bars are 8 μm (Magnification, × 1,000). n = 4. Quantitative data are presented as a mean ± S.E.M. All blots and immunofluorescence images are representative. *p < 0.05 vs. normoxia control, #p < 0.05 vs. hypoxia
Fig. 4
Fig. 4
Involvement of Akt/GSK3β pathway in BICD1-mediated HIF1α nuclear translocation. a–e The UCB-MSCs were transfected with GSK3β or NT siRNA for 24 h prior to hypoxia treatment for 24 h. a Co-immunoprecipitation of HIF1α and Dynein IC with IgG and BICD1 antibodies were shown in left panel. Total protein expressions in lysate were shown in right panel. n = 3. b Interaction between HIF1α and BICD1 (HIF1α/BICD1, red) was analyzed by PLA assay. Scale bars are 8 μm (Magnification, × 1,000). n = 5. c HIF1α, Lamin A/C, and α-Tubulin in cytosolic and nuclear fractionized samples were detected by western blot. n = 4. d Cells were immunostained with HIF1α-specific antibody. Scale bars are 8 μm (Magnification, × 1,000). n = 4. e HIF1 activities in NT or GSK3β siRNA-transfected cells were analyzed by dual luciferase reporter assay. n = 6. Quantitative data are presented as a mean ± S.E.M. All blots and immunofluorescence images are representative. *p < 0.05 vs. normoxia control with NT siRNA transfection, #p < 0.05 vs. hypoxia with NT siRNA transfection
Fig. 5
Fig. 5
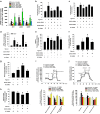
Role of BICD1 or GSK3β in glycolysis and ROS accumulation in UCB-MSCs under hypoxia. (a–e, i, j) The UCB-MSCs were transfected BICD1, BICD2, GSK3β, or NT siRNA for 24 h prior to hypoxia treatment for 24 h. a mRNA expression levels of HK1, LDHA, and G6PD were analyzed by quantitative real-time PCR. n = 5. Gene expression levels were normalized by 18S rRNA expression level. b, c Hexokinase activity and lactate production in cells were analyzed by using commercial kit. n = 6. d mRNA expression level of NHE1 was analyzed by quantitative real-time PCR. n = 5. Gene expression levels were normalized by 18S rRNA expression level. e Intracellular alkalization was measured by BCECF-AM staining. n = 8. f–h The UCB-MSCs were transfected BICD1, GSK3β, or NT siRNA for 24 h prior to hypoxia treatment for 48 h. Intracellular ROS, mitochondrial ROS, and mitochondrial membrane potential of cells were measured by luminometer. n = 8. i Oxygen consumption rate (OCR) changes under mitochondrial stress test in UCB-MSCs under normoxia or hypoxia were measured by using Seahorse XF24 Extracellular Flux analyzer. n = 5. Statistics of basal respiration, maximal respiration, and spare respiratory capacity were presented in lower panel. j Extracellular acidification rate (ECAR) changes under glycolysis stress test in UCB-MSCs under normoxia or hypoxia were measured by using Seahorse XF24 Extracellular Flux analyzer. n = 5. Statistics of glycolysis, glycolytic capacity, and glycolytic reserve were presented in lower panel. Quantitative data are presented as a mean ± S.E.M. *p < 0.05 vs. normoxia control with NT siRNA transfection, #p < 0.05 vs. hypoxia with NT siRNA transfection
Fig. 6
Fig. 6
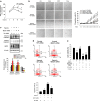
Role of BICD1 in UCB-MSCs survival under hypoxia. a, b The UCB-MSCs were transfected with BICD1 or NT siRNA for 24 h prior to hypoxia treatment. a Cells were exposed to various durations of hypoxia (0–72 h). Cell viability of UCB-MSCs was measured by WST-1 cell viability assay. n = 8. b Cells were incubated in normoxia or hypoxia conditions for 72 h. Representative images of experimental groups at 0, 24, 48, and 72 h of normoxia or hypoxia incubation are presented. Red-marked cells in representative images indicate PI-positive cells. n = 4. Scale bars are 50 μm (Magnification, × 200). c BICD1 or NT siRNA-transfected cells were incubated in hypoxia for 24 h. Cleaved caspase-9, cleaved caspase-3, and β-Actin protein expressions were detected by western blot analysis. n = 4. d Cells were transfected with BICD1 or NT siRNA for 24 h prior to hypoxia treatment for 48 h. The percentages of apoptotic cells were analyzed by Annexin V/PI analysis, measured by flowcytometer. Annexin V-positive cells were considered as apoptotic cells. n = 4. Quantitative data are presented as a mean ± S.E.M. All blot images are representative. *p < 0.05 vs. normoxia control with NT siRNA transfection, #p < 0.05 vs. hypoxia with NT siRNA transfection. e The UCB-MSCs were transfected with pcDNA3.1/BICD1-cEGFP vector, pcDNA3.1/cEGFP vector, HIF1A siRNA or NT siRNA for 24 h prior to hypoxia treatment for 72 h. Cell viability data are presented as a mean ± S.E.M. n = 5. *p< 0.05 vs. normoxia control with pcDNA3.1/cEGFP vector and NT siRNA cotransfection, #p< 0.05 vs. hypoxia control with pcDNA3.1/cEGFP vector and NT siRNA cotransfection, @p< 0.05 vs. hypoxia control with pcDNA3.1/BICD1-cEGFP vector and NT siRNA cotransfection
Fig. 7
Fig. 7
Effect of BICD1 regulation on skin wound healing capacity of UCB-MSC transplantation. a–e Mouse skin wound surgery with vehicle or UCB-MSC transplantation was conducted as described in Materials and methods. HP-MSC indicates mice group given hypoxia-pretreated UCB-MSCs with NT siRNA. a Skin wound size was compared with post-injection day 0. n = 12. b Tissue samples at post-injection day 10 were stained with hematoxylin and eosin. Scale bars are 200 μm (Magnification, × 40). n = 7. c Vessel distribution was quantified with ImageJ software. n = 10. d, e Tissue slides were immunostained with CD31, HNA, and α-SMA-specific antibodies. The percentages of CD31, HNA, and α-SMA-positive cells in DAPI-positive were analyzed by using Metamorph software. Scale bars are 100 μm (Magnification, × 100). n = 4. Quantitative data are presented as a mean ± S.E.M. All gross and immunofluorescence images are representative. $p < 0.05 vs. vehicle group, *p < 0.05 vs. MSC group with NT siRNA, #p < 0.05 vs. HP-MSC with NT siRNA. N.D. indicates not detected
Fig. 8
Fig. 8
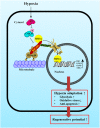
The schematic model for mechanism of BICD1-mediated HIF1α nuclear translocation in UCB-MSCs under hypoxia. Hypoxia induces GSK3β phosphorylation at Ser9 residue via Akt activation. Silencing of GSK3β induces the interaction between BICD1 and HIF1α. BICD1 regulation by Akt activation or GSK3β silencing stimulates HIF1α nuclear translocation. BICD1-mediated HIF1α nuclear translocation is critical for hypoxia adaptation, enhances regenerative potential of UCB-MSCs transplantation

Similar articles

Cited by

References

    1. Kim JW, Tchernyshyov I, Semenza GL, Dang CV. HIF-1-mediated expression of pyruvate dehydrogenase kinase: a metabolic switch required for cellular adaptation to hypoxia. Cell Metab. 2006;3:177–85. doi: 10.1016/j.cmet.2006.02.002. - DOI - PubMed
    1. Zhang CC, Sadek HA. Hypoxia and metabolic properties of hematopoietic stem cells. Antioxid Redox Signal. 2014;20:1891–901. doi: 10.1089/ars.2012.5019. - DOI - PMC - PubMed
    1. Chen J, Kang JG, Keyvanfar K, Young NS, Hwang PM. Long-term adaptation to hypoxia preserves hematopoietic stem cell function. Exp Hematol. 2016;44:866–73. doi: 10.1016/j.exphem.2016.04.010. - DOI - PMC - PubMed
    1. Choudhry H, Harris AL. Advances in hypoxia-inducible factor biology. Cell Metab. 2018;27:281–98. doi: 10.1016/j.cmet.2017.10.005. - DOI - PubMed
    1. Ito K, Suda T. Metabolic requirements for the maintenance of self-renewing stem cells. Nat Rev Mol Cell Biol. 2014;15:243–56. doi: 10.1038/nrm3772. - DOI - PMC - PubMed

Publication types

MeSH terms