

Methylenetetrahydrofolate Dehydrogenase 1 (MTHFD1) is Underexpressed in Clear Cell Renal Cell Carcinoma Tissue and Transfection and Overexpression in Caki-1 Cells Inhibits Cell Proliferation and Increases Apoptosis
- PMID: 30459299
- PMCID: PMC6259576
- DOI: 10.12659/MSM.911124
Methylenetetrahydrofolate Dehydrogenase 1 (MTHFD1) is Underexpressed in Clear Cell Renal Cell Carcinoma Tissue and Transfection and Overexpression in Caki-1 Cells Inhibits Cell Proliferation and Increases Apoptosis
Abstract
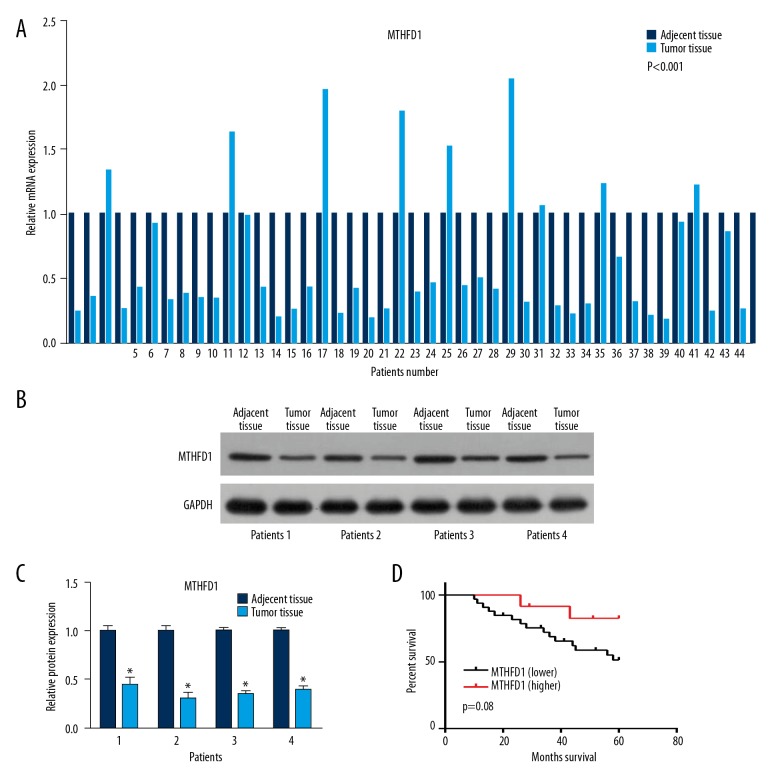
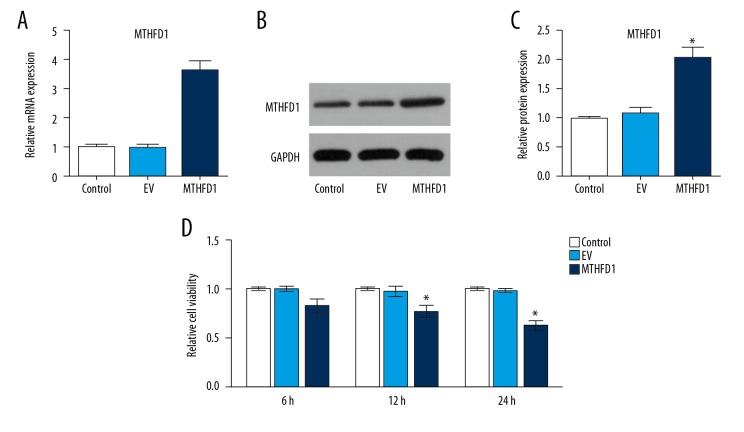
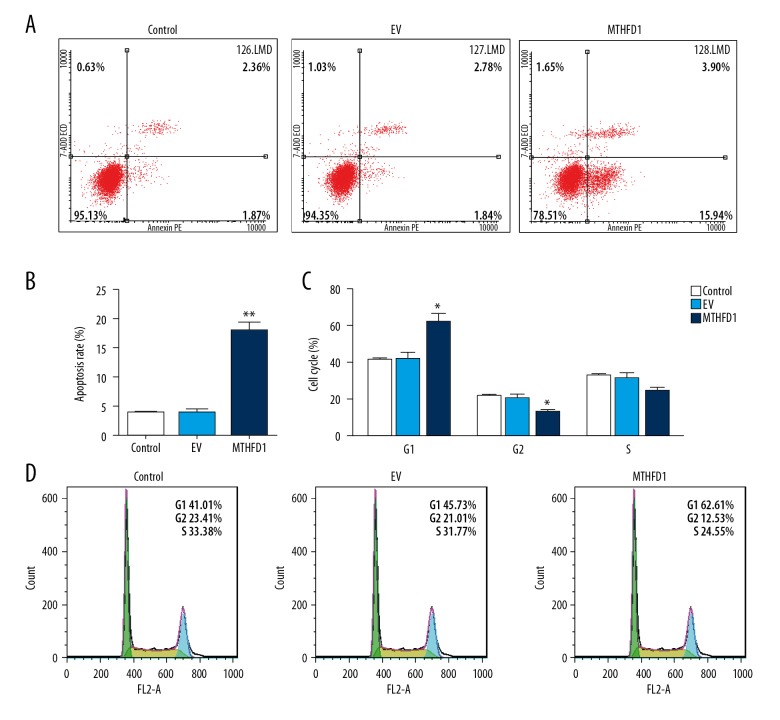
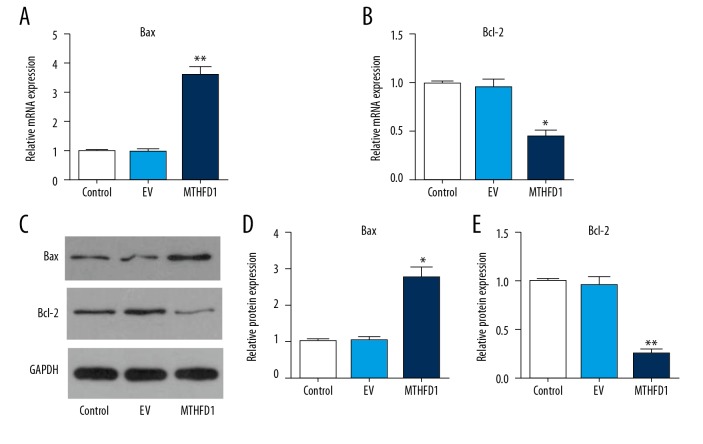
BACKGROUND The aims of this study were to investigate the expression of methylenetetrahydrofolate dehydrogenase 1 (MTHFD1) in human tissue containing clear cell renal cell carcinoma (CCRCC) compared with normal renal tissue, and the effects of upregulating the expression of MTHFD1 in the human CCRCC cell line, Caki-1. MATERIAL AND METHODS Tumor and adjacent normal renal tissue were obtained from 44 patients who underwent radical nephrectomy for CCRCC. Caki-1 human CCRCC cells were divided into the control group, the empty vector (EV) group, and the plasmid-treated group that overexpressed MTHFD1. MTHFD1 mRNA and protein levels were measured by quantitative real-time polymerase chain reaction (qRT-PCR) and Western blot, respectively. The cell counting kit-8 (CCK-8) assay measured cell viability. Flow cytometry evaluated apoptosis and the cell cycle. Western blot measured the protein levels of MTHFD1, Bax, Bcl-2, Akt, p53, and cyclin D1, and qRT-PCR determined the gene expression profiles. RESULTS MTHFD1 mRNA and protein levels in CCRCC tumor tissues were significantly lower compared with adjacent normal renal tissue. MTHFD1 over-expression in Caki-1 cells inhibited cell proliferation, arrested cells in the G1 phase, increased cell apoptosis, and upregulated gene and protein expression of Bax/Bcl-2 and p53 and inhibited p-Akt, and cyclin D1. CONCLUSIONS MTHFD1 was underexpressed in CCRCC tissue when compared with normal renal tissue. MTHFD1 transfection of human CCRCC Caki-1 cells in vitro inhibited cell proliferation and promoted apoptosis, associated with reduced expression of cyclin D1, reduced Akt phosphorylation, and increased expression of Bax/Bcl-2 and p53.
Conflict of interest statement
None.
Figures

Similar articles
-
Methylenetetrahydrofolate Dehydrogenase 1 Silencing Expedites the Apoptosis of Non-Small Cell Lung Cancer Cells via Modulating DNA Methylation.Med Sci Monit. 2018 Oct 21;24:7499-7507. doi: 10.12659/MSM.910265. Med Sci Monit. 2018. PMID: 30343310 Free PMC article.
-
VHL missense mutations in the p53 binding domain show different effects on p53 signaling and HIFα degradation in clear cell renal cell carcinoma.Oncotarget. 2017 Feb 7;8(6):10199-10212. doi: 10.18632/oncotarget.14372. Oncotarget. 2017. PMID: 28052007 Free PMC article.
-
Overexpression of BTG2 suppresses growth, migration, and invasion of human renal carcinoma cells in vitro.Neoplasma. 2016;63(3):385-93. doi: 10.4149/307_150822N455. Neoplasma. 2016. PMID: 26925784
-
Long Non-Coding RNA LUCAT1 Promotes Proliferation and Invasion in Clear Cell Renal Cell Carcinoma Through AKT/GSK-3β Signaling Pathway.Cell Physiol Biochem. 2018;48(3):891-904. doi: 10.1159/000491957. Epub 2018 Jul 20. Cell Physiol Biochem. 2018. PMID: 30032137
-
Bcl-2 in cell cycle regulation.Cell Cycle. 2004 Jan;3(1):7-9. Cell Cycle. 2004. PMID: 14657653 Review. No abstract available.
References
-
- Lindblad P. Epidemiology of renal cell carcinoma. Scand J Surg. 2004;93(2):88–96. - PubMed
-
- Ma J, Peng J, Mo R, et al. Ubiquitin E3 ligase UHRF1 regulates p53 ubiquitination and p53-dependent cell apoptosis in clear cell renal cell carcinoma. Biochem Biophys Res Commun. 2015;464(1):147–53. - PubMed
-
- Furniss D, Harnden P, Ali N, et al. Prognostic factors for renal cell carcinoma. Cancer Treat Rev. 2008;34(5):407–26. - PubMed
-
- Volpe A, Patard JJ. Prognostic factors in renal cell carcinoma. World J Urol. 2010;28(3):319–27. - PubMed
MeSH terms
Substances
LinkOut - more resources
Full Text Sources
Medical
Research Materials
Miscellaneous
