Empirical assessment of the impact of sample number and read depth on RNA-Seq analysis workflow performance
- PMID: 30428853
- PMCID: PMC6234607
- DOI: 10.1186/s12859-018-2445-2
Empirical assessment of the impact of sample number and read depth on RNA-Seq analysis workflow performance
Abstract
Background: RNA-Sequencing analysis methods are rapidly evolving, and the tool choice for each step of one common workflow, differential expression analysis, which includes read alignment, expression modeling, and differentially expressed gene identification, has a dramatic impact on performance characteristics. Although a number of workflows are emerging as high performers that are robust to diverse input types, the relative performance characteristics of these workflows when either read depth or sample number is limited-a common occurrence in real-world practice-remain unexplored.
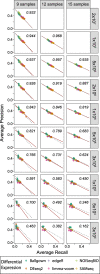
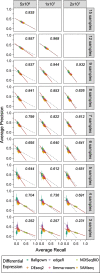
Results: Here, we evaluate the impact of varying read depth and sample number on the performance of differential gene expression identification workflows, as measured by precision, or the fraction of genes correctly identified as differentially expressed, and by recall, or the fraction of differentially expressed genes identified. We focus our analysis on 30 high-performing workflows, systematically varying the read depth and number of biological replicates of patient monocyte samples provided as input. We find that, in general for most workflows, read depth has little effect on workflow performance when held above two million reads per sample, with reduced workflow performance below this threshold. The greatest impact of decreased sample number is seen below seven samples per group, when more heterogeneity in workflow performance is observed. The choice of differential expression identification tool, in particular, has a large impact on the response to limited inputs.
Conclusions: Among the tested workflows, the recall/precision balance remains relatively stable at a range of read depths and sample numbers, although some workflows are more sensitive to input restriction. At ranges typically recommended for biological studies, performance is more greatly impacted by the number of biological replicates than by read depth. Caution should be used when selecting analysis workflows and interpreting results from low sample number experiments, as all workflows exhibit poorer performance at lower sample numbers near typically reported values, with variable impact on recall versus precision. These analyses highlight the performance characteristics of common differential gene expression workflows at varying read depths and sample numbers, and provide empirical guidance in experimental and analytical design.
Keywords: Gene expression analysis; Monocytes; RNA-sequencing; Read depth; Sample number.
Conflict of interest statement
Ethics approval and consent to participate
Not applicable.
Consent for publication
Not applicable.
Competing interests
The authors declare that they have no competing interests.
Publisher’s Note
Springer Nature remains neutral with regard to jurisdictional claims in published maps and institutional affiliations.
Figures


Similar articles
-
Empirical assessment of analysis workflows for differential expression analysis of human samples using RNA-Seq.BMC Bioinformatics. 2017 Jan 17;18(1):38. doi: 10.1186/s12859-016-1457-z. BMC Bioinformatics. 2017. PMID: 28095772 Free PMC article.
-
A benchmarking of workflows for detecting differential splicing and differential expression at isoform level in human RNA-seq studies.Brief Bioinform. 2019 Mar 22;20(2):471-481. doi: 10.1093/bib/bbx122. Brief Bioinform. 2019. PMID: 29040385
-
Characterization and improvement of RNA-Seq precision in quantitative transcript expression profiling.Bioinformatics. 2011 Jul 1;27(13):i383-91. doi: 10.1093/bioinformatics/btr247. Bioinformatics. 2011. PMID: 21685096 Free PMC article.
-
Best practices on the differential expression analysis of multi-species RNA-seq.Genome Biol. 2021 Apr 29;22(1):121. doi: 10.1186/s13059-021-02337-8. Genome Biol. 2021. PMID: 33926528 Free PMC article. Review.
-
Misuse of RPKM or TPM normalization when comparing across samples and sequencing protocols.RNA. 2020 Aug;26(8):903-909. doi: 10.1261/rna.074922.120. Epub 2020 Apr 13. RNA. 2020. PMID: 32284352 Free PMC article. Review.
Cited by
-
Investigating differential abundance methods in microbiome data: A benchmark study.PLoS Comput Biol. 2022 Sep 8;18(9):e1010467. doi: 10.1371/journal.pcbi.1010467. eCollection 2022 Sep. PLoS Comput Biol. 2022. PMID: 36074761 Free PMC article. Review.
-
Library adaptors with integrated reference controls improve the accuracy and reliability of nanopore sequencing.Nat Commun. 2022 Oct 28;13(1):6437. doi: 10.1038/s41467-022-34028-8. Nat Commun. 2022. PMID: 36307482 Free PMC article.
-
Comparative Analysis of rRNA Removal Methods for RNA-Seq Differential Expression in Halophilic Archaea.Biomolecules. 2022 May 10;12(5):682. doi: 10.3390/biom12050682. Biomolecules. 2022. PMID: 35625610 Free PMC article.
-
Bioinformatics Strategies to Identify Shared Molecular Biomarkers That Link Ischemic Stroke and Moyamoya Disease with Glioblastoma.Pharmaceutics. 2022 Jul 28;14(8):1573. doi: 10.3390/pharmaceutics14081573. Pharmaceutics. 2022. PMID: 36015199 Free PMC article.
-
Evaluation of Oxford Nanopore MinION RNA-Seq Performance for Human Primary Cells.Int J Mol Sci. 2021 Jun 12;22(12):6317. doi: 10.3390/ijms22126317. Int J Mol Sci. 2021. PMID: 34204756 Free PMC article.
References
-
- Nookaew I, Papini M, Pornputtapong N, Scalcinati G, Fagerberg L, Uhlén M, et al. A comprehensive comparison of RNA-Seq-based transcriptome analysis from reads to differential gene expression and cross-comparison with microarrays: a case study in Saccharomyces cerevisiae. Nucleic Acids Res. 2012;40:10084–10097. doi: 10.1093/nar/gks804. - DOI - PMC - PubMed
MeSH terms
Substances
Grants and funding
LinkOut - more resources
Full Text Sources

