

Permanent and Transient Electrophysiological Effects During Cardiac Cryoablation Documented by Optical Activation Mapping and Thermal Imaging
- PMID: 30418875
- PMCID: PMC6667312
- DOI: 10.1109/TBME.2018.2880408
Permanent and Transient Electrophysiological Effects During Cardiac Cryoablation Documented by Optical Activation Mapping and Thermal Imaging
Abstract
Objective: Cardiac catheter cryoablation is a safer alternative to radiofrequency ablation for arrhythmia treatment, but electrophysiological (EP) effects during and after freezing are not adequately characterized. The goal of this study was to determine transient and permanent temperature induced EP effects, during and after localized tissue freezing.
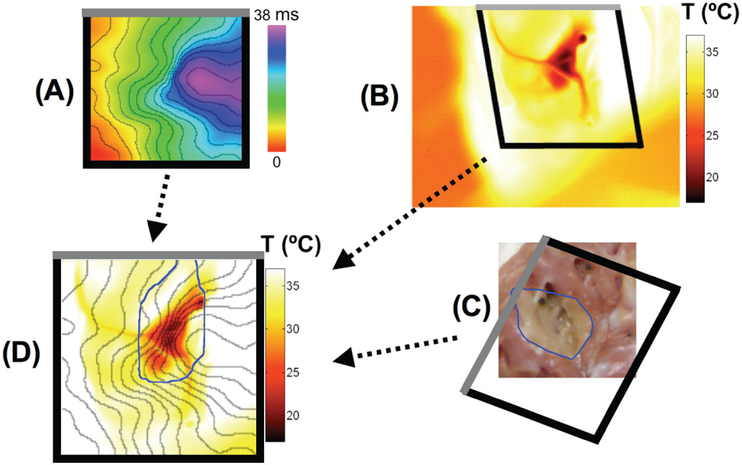
Methods: Conduction in right (RV) and left ventricles (LV) was studied by optical activation mapping during and after cryoablation in paced, isolated Langendorff-perfused porcine hearts. Cryoablation was performed endocardially (n=4) or epicardially (n=4) by a cryoprobe cooled to -120 °C for 8 minutes. Epicardial surface temperature was imaged with an infrared camera. Viability staining was performed after ablation. Motion compensation and co-registration was performed between optical mapping data, temperature image data, and lesion images.
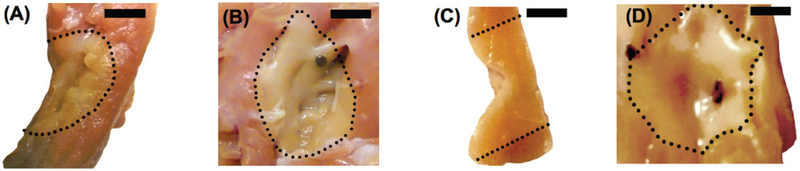
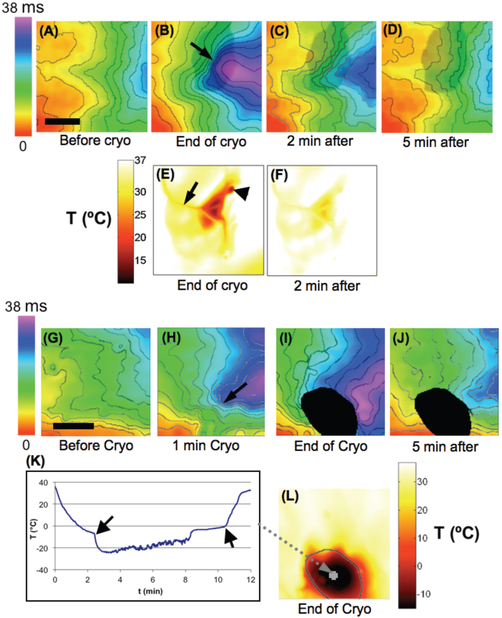
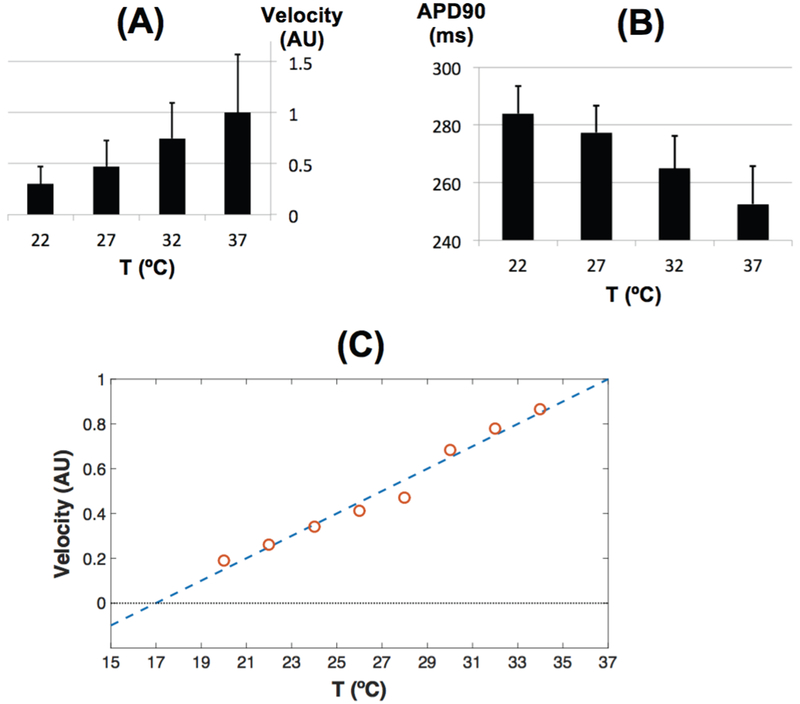
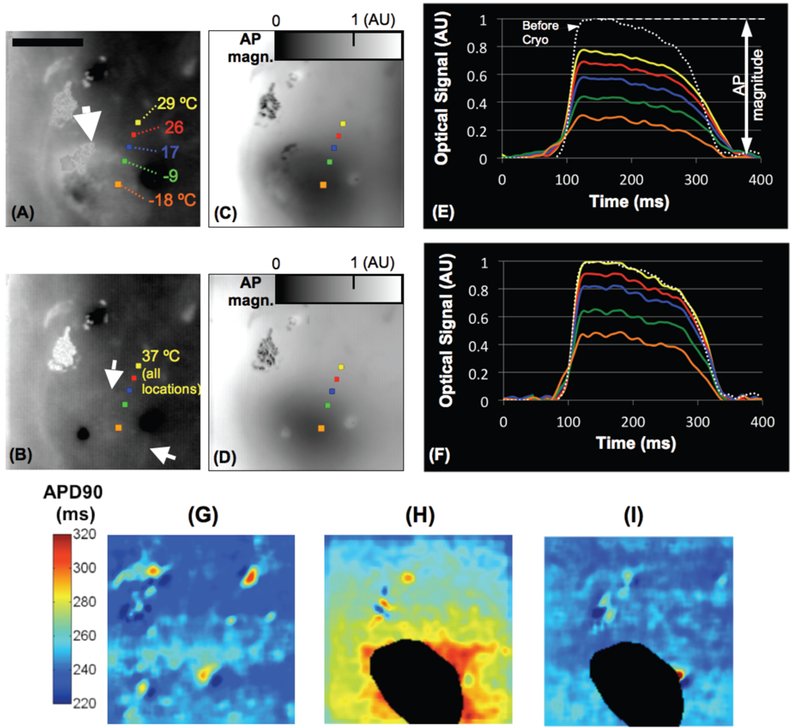
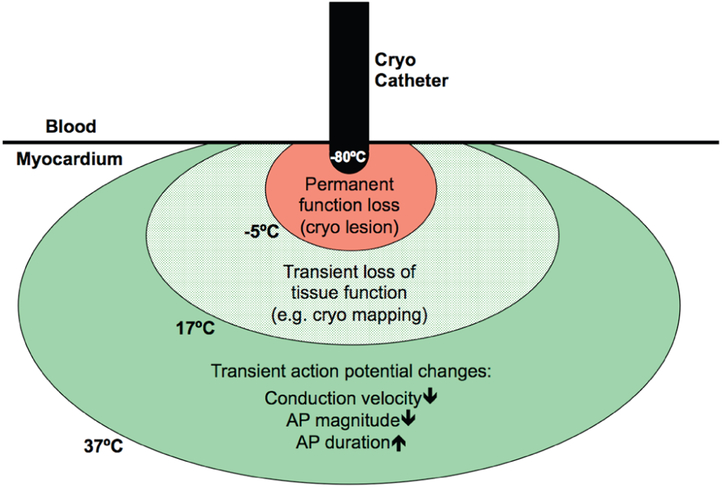
Results: Cryoablation produced lesions 14.9 +/- 3.1 mm in diameter and 5.8 +/- 1.7 mm deep. A permanent lesion was formed in tissue cooled below -5 +/- 4 °C. Transient EP changes observed at temperatures between 17 and 37 °C during cryoablation surrounding the frozen tissue region directly correlated with local temperature, and include action potential (AP) duration prolongation, decrease in AP magnitude, and slowing in conduction velocity (Q10=2.0). Transient conduction block was observed when epicardial temperature reached <17 °C, but completely resolved upon tissue rewarming, within 5 minutes.
Conclusion: Transient EP changes were observed surrounding the permanent cryo lesion (<-5 °C), including conduction block (-5 to 17 °C), and reduced conduction velocity (>17 °C).
Significance: The observed changes explain effects observed during clinical cryoablation, including transient increases in effective refractory period, transient conduction block, and transient slowing of conduction. The presented quantitative data on temperature dependence of EP effects may enable the prediction of the effects of clinical cryoablation devices.
Figures
Similar articles
-
Intracardiac ablation for atrioventricular nodal reentry tachycardia using a 6 mm distal electrode cryoablation catheter: Prospective, multicenter, North American study (ICY-AVNRT STUDY).J Cardiovasc Electrophysiol. 2018 Jan;29(1):167-176. doi: 10.1111/jce.13367. Epub 2017 Nov 10. J Cardiovasc Electrophysiol. 2018. PMID: 29044787
-
Safety and efficacy of cryoablation of accessory pathways adjacent to the normal conduction system.J Cardiovasc Electrophysiol. 2003 Aug;14(8):825-9. doi: 10.1046/j.1540-8167.2003.03076.x. J Cardiovasc Electrophysiol. 2003. PMID: 12890043 Clinical Trial.
-
Transvenous cold mapping and cryoablation of the AV node in dogs: observations of chronic lesions and comparison to those obtained using radiofrequency ablation.J Cardiovasc Electrophysiol. 1998 Oct;9(10):1055-61. doi: 10.1111/j.1540-8167.1998.tb00883.x. J Cardiovasc Electrophysiol. 1998. PMID: 9817557
-
Time and temperature profile of catheter cryoablation of right septal and free wall accessory pathways in children.J Cardiovasc Electrophysiol. 2008 Apr;19(4):343-7. doi: 10.1111/j.1540-8167.2007.01048.x. Epub 2007 Dec 12. J Cardiovasc Electrophysiol. 2008. PMID: 18081772
-
[Transcatheter cryoablation in children: state of the art].G Ital Cardiol (Rome). 2008 Feb;9(2):104-8. G Ital Cardiol (Rome). 2008. PMID: 18383772 Review. Italian.
References
-
- Collins KK, Dubin AM, Chiesa NA, Avasarala K, and Van Hare GF, “Cryoablation versus radiofrequency ablation for treatment of pediatric atrioventricular nodal reentrant tachycardia: initial experience with 4-mm cryocatheter,” Heart Rhythm, vol. 3, no. 5, pp. 564–70, May, 2006. - PubMed
-
- Miyazaki A, Blaufox AD, Fairbrother DL, and Saul JP, “Prolongation of the fast pathway effective refractory period during cryoablation in children: a marker of slow pathway modification,” Heart Rhythm, vol. 2, no. 11, pp. 1179–85, November, 2005. - PubMed
-
- Tuzcu V, “Cryoablation of accessory pathways in children,” Pacing Clin Electrophysiol, vol. 30, no. 9, pp. 1129–35, September, 2007. - PubMed
-
- Khairy P, Chauvet P, Lehmann J, Lambert J, Macle L, Tanguay JF, Sirois MG, Santoianni D, and Dubuc M, “Lower incidence of thrombus formation with cryoenergy versus radiofrequency catheter ablation,” Circulation, vol. 107, no. 15, pp. 2045–50, April 22, 2003. - PubMed
-
- Holman WL, Ikeshita M, Ungerleider RM, Smith PK, Ideker RE, and Cox JL, “Cryosurgery for cardiac arrhythmias: acute and chronic effects on coronary arteries,” Am J Cardiol, vol. 51, no. 1, pp. 149–55, January 1, 1983. - PubMed
